Breakwater Survey using HydroFrog 25 USV with GeoScope 200 and Ping3DSS sonar
2025-04-23
On 15-16 February 2025, Ocean Physics Technology Co., Ltd. and a user organised a demonstration of the HydroFrog 25 USV carrying the OPT GS-200 parametric subbottom profiler and Ping 3DSS iDX-450 3D SideScan and Swath sonar system in a sea area of Fuqing City. The main purpose was to survey the submerged part of the seawall in the target sea area.
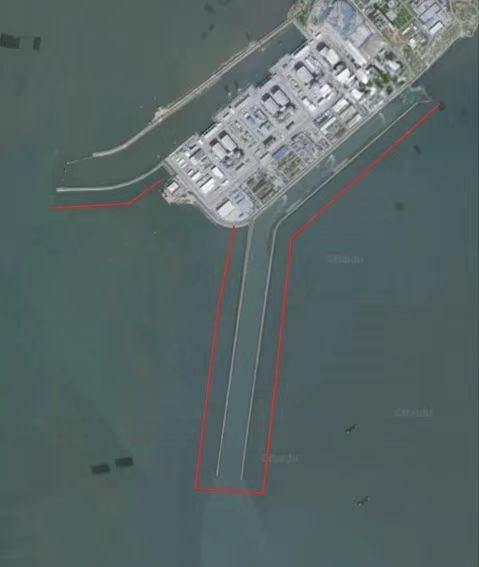
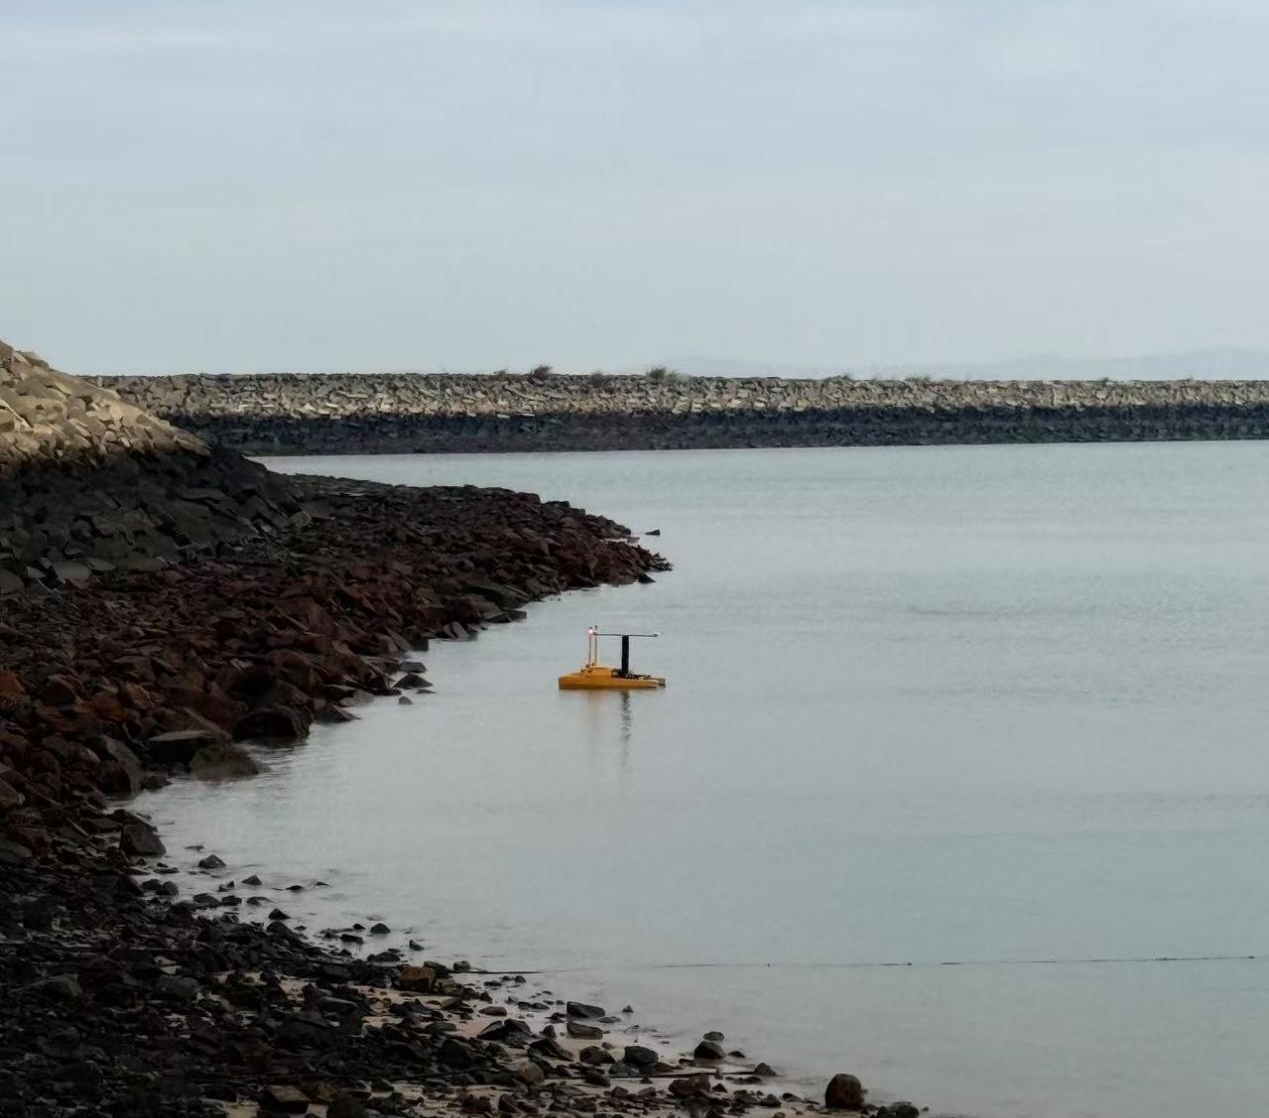
The test area is located in a sea area of Fuqing (the area marked by a red line). The breakwater is greatly affected by tides, so the survey needs to be completed quickly during high tide. At the same time, the surrounding area of the observation site is densely populated by fishermen with aquaculture nets, which poses a great challenge to the safety and operation of USVs.
2. System used during the survey
2.1 HydroFrog 25 USV
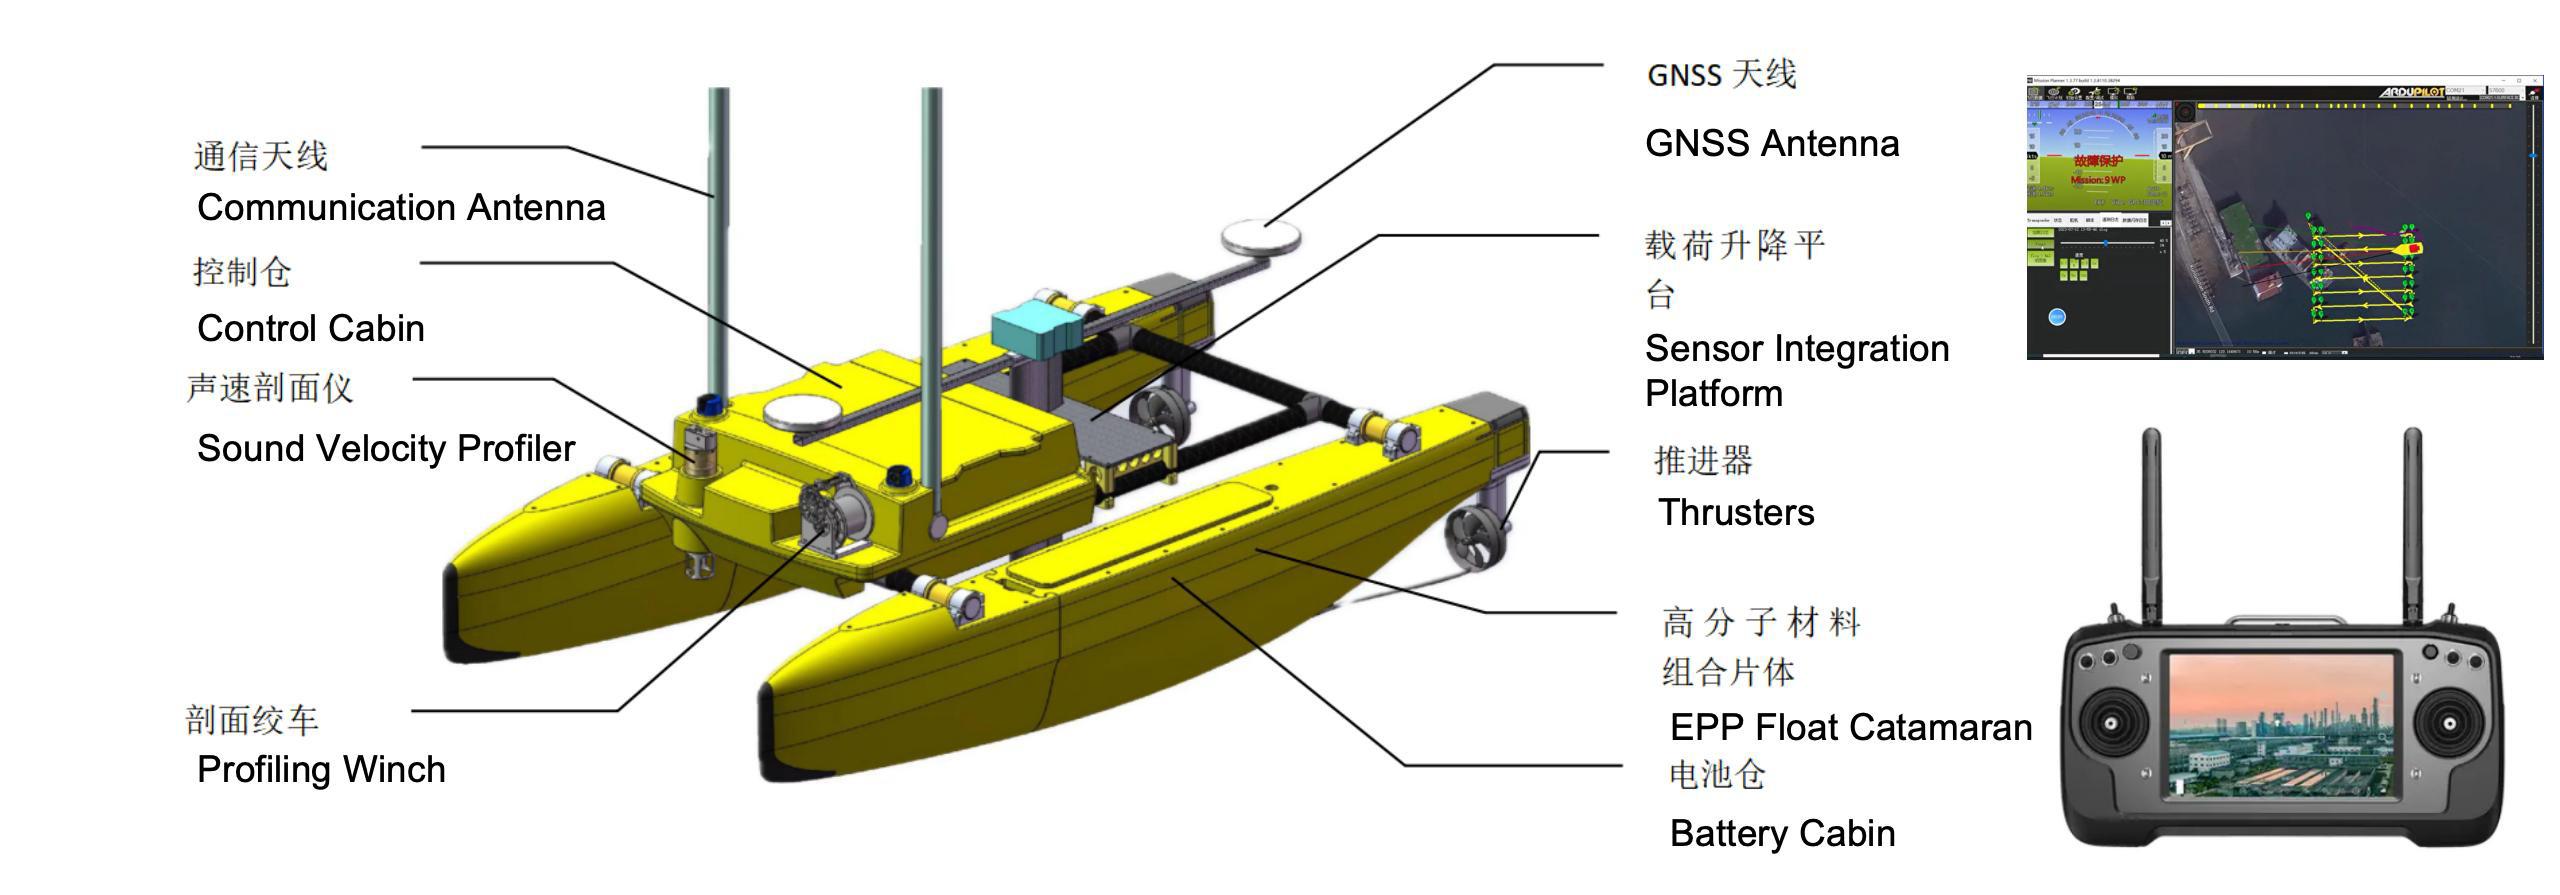
HydroFrog 25 is a multi-purpose unmanned vessel system developed and produced by OPT. 2.5 metres in length, HydroFrog 25 utilises a catamaran structure with stable rolling, and an open truss structure in the centre, which allows it to carry single-beam and multi-beam echosounder, sub-bottom profilers, ADCPs, multi-sensor instruments and other equipment to carry out different scenarios and tasks.
The HydroFrog 25 features replaceable and expandable IP68 rated battery packs, electric propulsion and a self-developed power management system for long operating time, safe and stable charging, and environmental friendliness. The main connections can be quickly setup and dismantled, allowing the vessel to be assembled, mission equipment installed and deployed by one or two people in minutes. It could be folded up in a small SUV for transport.
HydroFrog 25 is equipped with a self-developed sound velocity profiler winch, which can collect the sound velocity profile data of the target area via surface control software of the USV. We can also provide a full set of mobile USV LARS system, which is suitable for most challenging project areas. Survey project can never be so convenient.
Technical Specifications | ||
Dimension(Operation) | 2.5 m (L) x 1.25 m (W) x 0.7 m (H) | |
Dimension(Transportation) | 1.6 m (L) x 1.2 m (W) x 0.5 m(H) | |
Weight | 25 kg (Hull weight only) | |
Draft under full load | 0.22 m | |
Payload | 45 kg | |
Maximum Speed | 8 - 10 kn | |
Survey Speed | 4 - 5 kn | |
Duration | Standard | |
Survey Speed | 5 h | |
Max. Speed | 2 h | |
Propulsion | 2 x 2.5 kW electrical thrusters | |
Hull Material | Flame retardant and environmentally friendly special polymer materials | |
Battery | 2 x 60Ah,38.4V Lithium Cell (Replaceable and expandable) | |
Ground Station | Standard 8-inch industrial remote control, remote control distance up to 2km (optional 10-inch large screen remote control) | |
Profile Winch(Optional) | Maximum cable length: 120m;Maximum 0.5m/s spooling;Support web browser, remote control;Payload 10kg; Size: 13 x 11 x 11 cm, Weight: 1.85kg |
2.2 GeoScope Series Subbottom Profiler
With single beam parametric array, GeoScope 200/300 features its compact and portable design, suitable for underwater sub-bottom profiling and precise bathymetry.
GeoScope offers primary frequency options of 200 kHz and 300 kHz, both of which generates wideband secondary frequencies. GeoScope 200/300 can acquire bathymetry and penetration data simultaneously.
The standard housing of transducer has 30X0m, 2000m and 6000m rated options and can be customized if necessary. The compact design makes it ideal for ROV, AUV or other subsea platform integration.
• High bandwidth portable transducer
• Compact and portable
• Experienced parametric technology during decades of R & D
• Primary frequency options of 200 kHz or 300 kHz
• Easy to install and operate
• Various options of transducer housing for different platform integration
• Optional high-resolution bathymetry
Technical Specifications | ||
Model | GS-200 | GS-300 |
Primary Frequency | 180 - 220 kHz | 270 - 330 kHz |
Secondary Frequency | 10 - 35 kHz | 10 - 35 kHz |
Pulse Length | 0.05 - 1 ms | 0.05 - 1 ms |
Pulse Type | CW,Chirp | CW,Chirp |
Ping Rate | up to 10 ping/s | up to 10 ping/s |
Beamwidth @ Primary Frequency | ~ 3.8 deg | ~ 3.6 deg |
Beamwidth @ Secondary Frequency | 3.4 - 4 deg | 4 - 5 deg |
Source Level @ Primary Frequency | ≥238 dB/uPa@1m 100kHz | ≥238 dB/uPa@1m 100kHz |
Source Level @ Secondary Frequency | ≥194 dB/uPa@1m 20kHz | ≥194 dB/uPa@1m 20kHz |
Dymanic Range | ≥110 dB | ≥110 dB |
Range Resolution | ≤4 cm | ≤4 cm |
Sediment Penetration | ≤25 m (depend on sediment type and noise) | ≤15 m (depend on sediment type and noise) |
Water Depth Range | ≤100 m | ≤50 m |
Heave / Roll / Pitch Compensation | heave (depend on external sensor data) | heave (depend on external sensor data) |
Bathymetry Resolution | 1.25 cm | 0.8 cm |
2.3 PING 3DSS-DX-450 3D Sidescan sonar
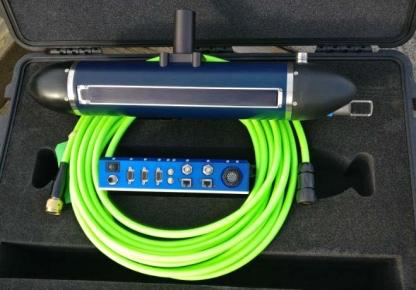
The 3DSS-DX utilizes state-of-the-art acoustic transducer array technologies, SoftSonar™ electronics, and advanced signal processing techniques to produce superior swath bathymetry and 3D side-scan imagery. This patented technology is able to resolve multiple concurrent acoustic arrivals, separating backscatter from the seabed, sea-surface, water-column and multipath arrivals. The result is stunning 3D side-scan imagery spanning the entire water-column, and superior swath bathymetry from a compact, easy-to-use sonar.
• Proven Bathymetry Accuracy and Repeatability (IHO Exclusive Order).
• High Resolution True 3D Imagery.
• Real-time 3D point cloud display and target capture software.
• Simultaneous 3D Side-scan, 2D Side-scan, and Bathymetry data outputs.
• Wide swath coverage, up to 14 times water depth.
• Patented processing techniques as well as beamforming eliminates multipath and surface reflection interference.
• Support for 3rd party hydrographic survey hardware and software.
• Compact, Low Power, easy-to-use. Suitable for ASV and AUV applications.
Frequency | 450 kHz |
Beamwidth | 0.4° |
Dimensions | 57 cm × ø9.8 cm |
Weight in Air | 8 kg |
Typical Power Consumption | 18 W |
3. Installation and Survey
HydroFrog 25 has lifting fins arranged on the truss. The upper base of the lifting fin is used to install a dual antenna, and the lower mounting base of the lifting fin is used to install the OPT GS-200 parametric array Subbottom Profiler and Ping 3DSS iDX-450 3D SideScan and Swath Sonar.
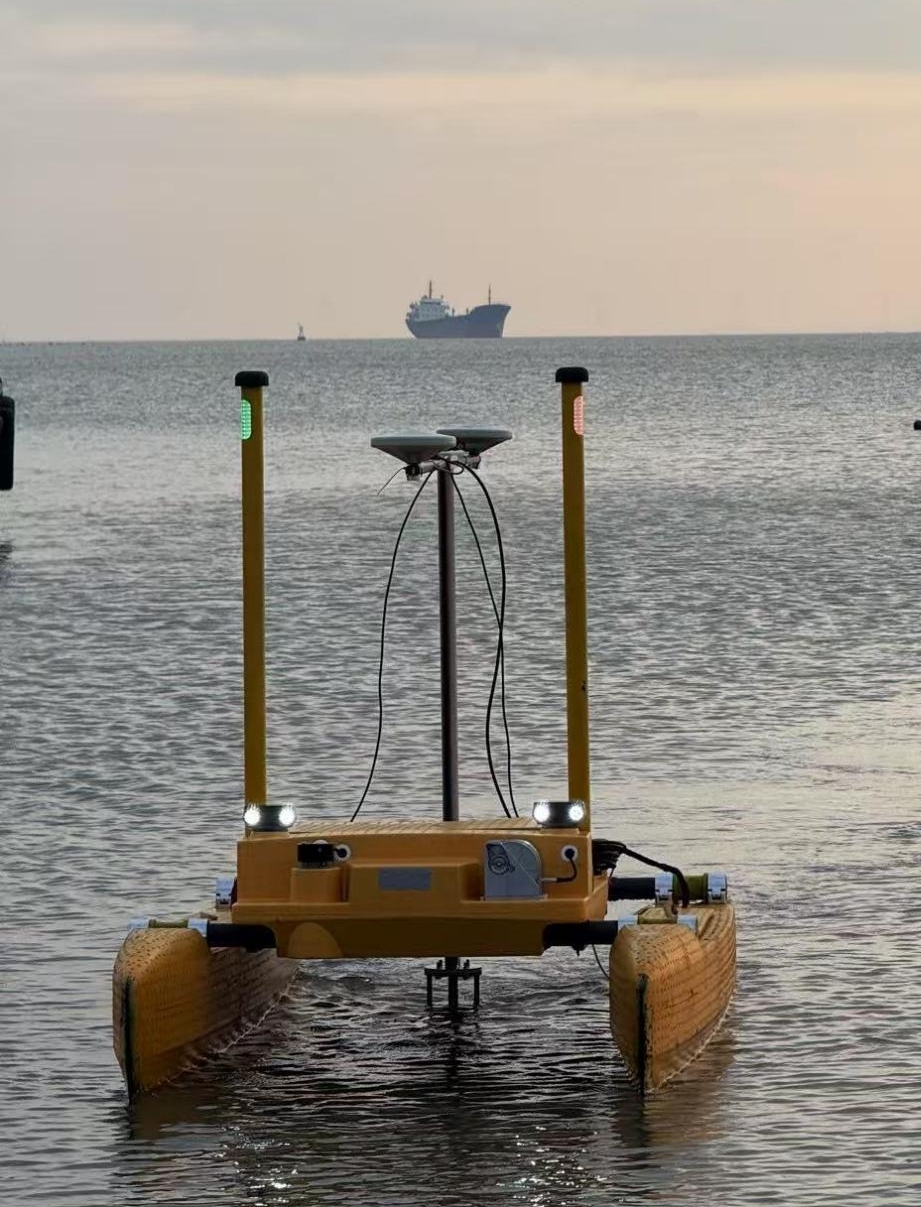
On the morning of 15 February, the demonstration area was reached, and the system was installed, the corresponding cables were connected, and the power-on test was completed. The HydroFrog 25 USV was functioning normally, as were the Subbottom Profiler and the 3DSS sonar. The side-scanning operation tasks were carried out in sequence.
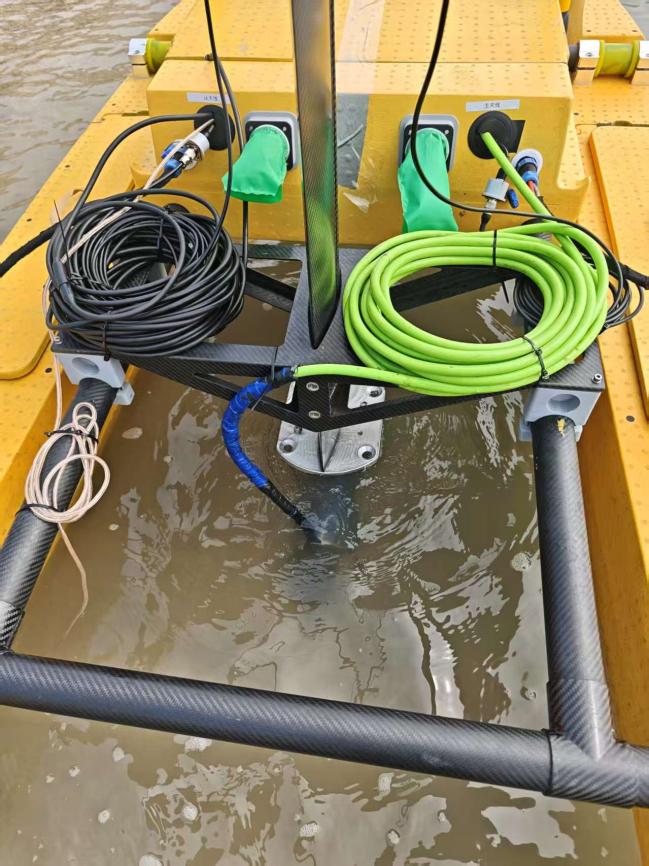
After the preparatory work for the survey was completed, the USV sailed at a speed of 1-2m/s in the direction of the survey line, and the survey was carried out using the GeoScope Subbottom Profiler and Ping3DSS respectively. The returned images were viewed in real time on the remote display interface, and the data quality was controlled by adjusting the acquisition software.
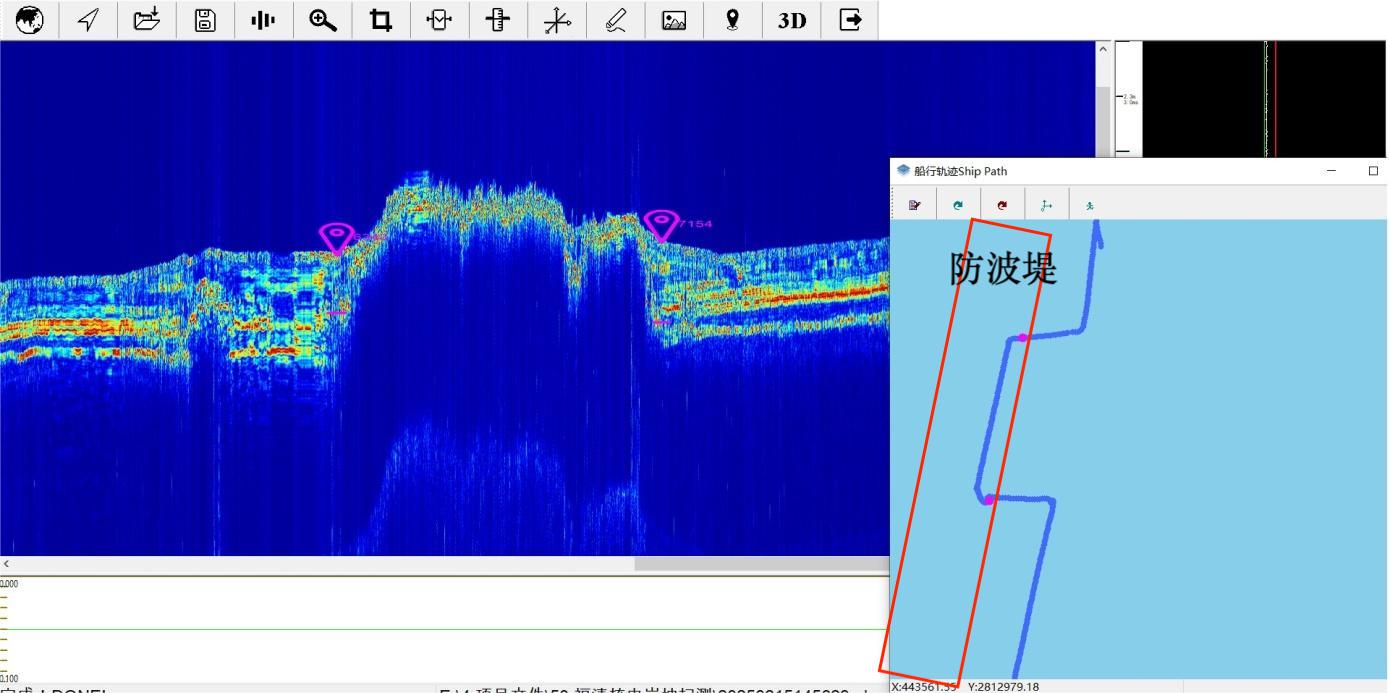
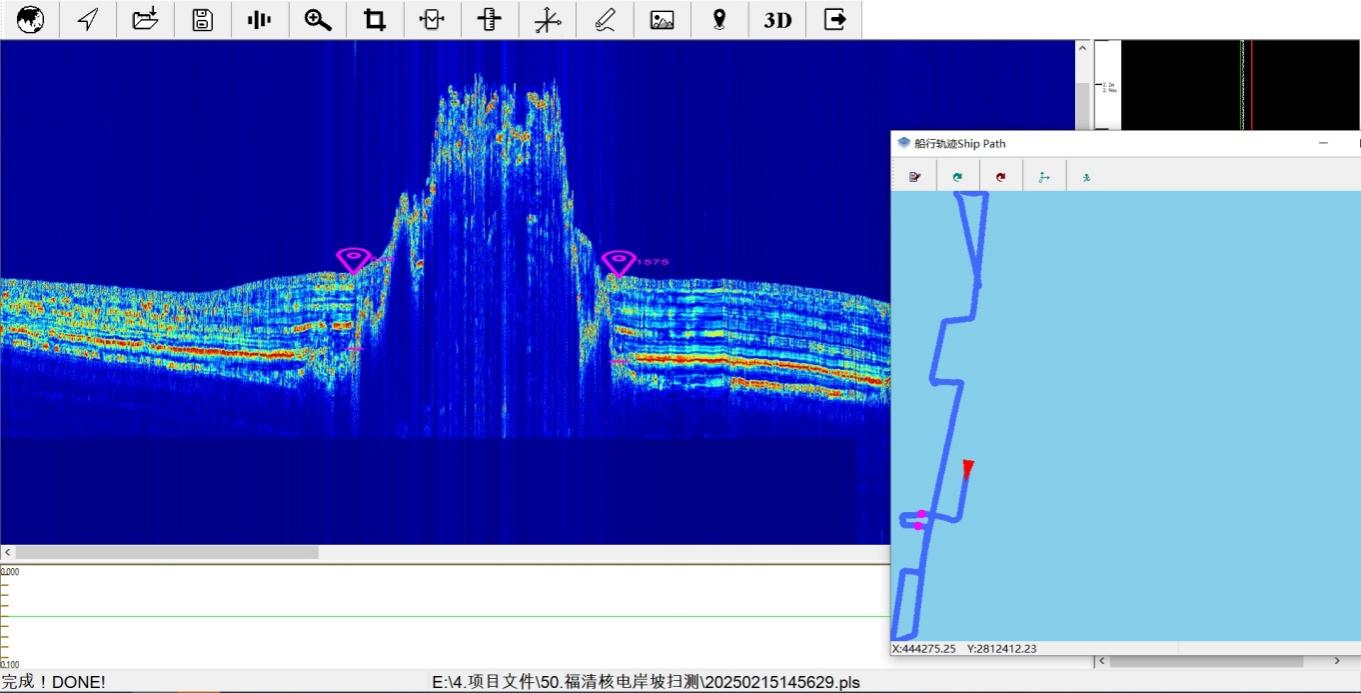
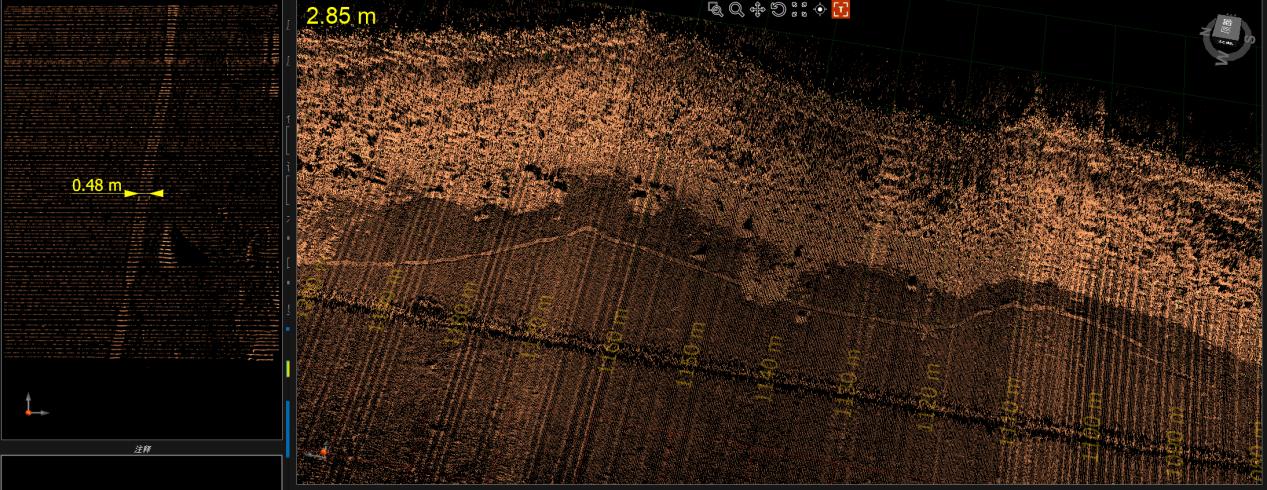
From the control terminal on the mother ship, the Subbottom Profiler echo image clearly distinguishes the sediment layer, the breakwater slope, and the structure below the breakwater's muddy surface. Ping3DSS collects three types of data at once: 3D point cloud, SideScan, and swath bathymetry. It can detect the information of targets in all spaces underwater, and provides an overview of the breakwater's operational area, including the wave-dissipating blocks, rock dumping, submarine reefs, and aquaculture cages. The boundary of the seabed of the breakwater can be marked and located in real time.
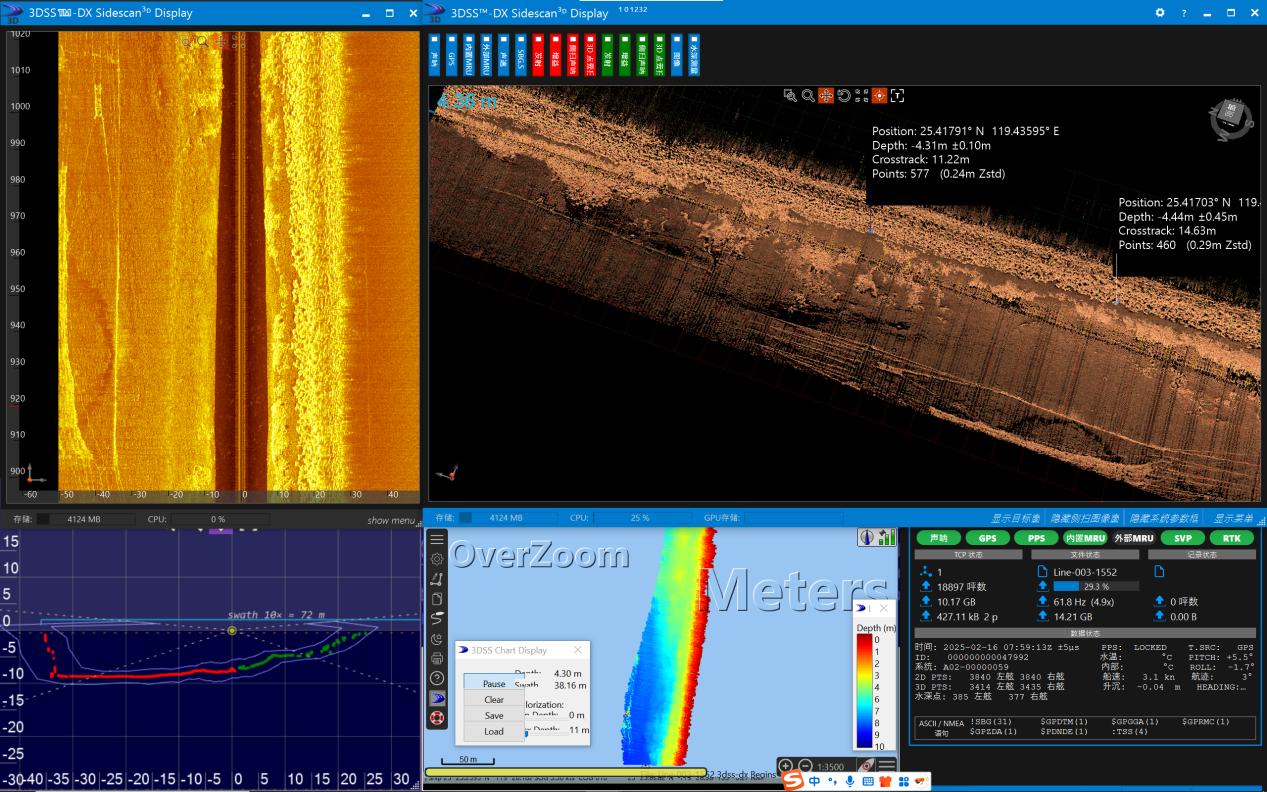
3D Point Cloud, Sidescan and bathymetry data shown in the same screen
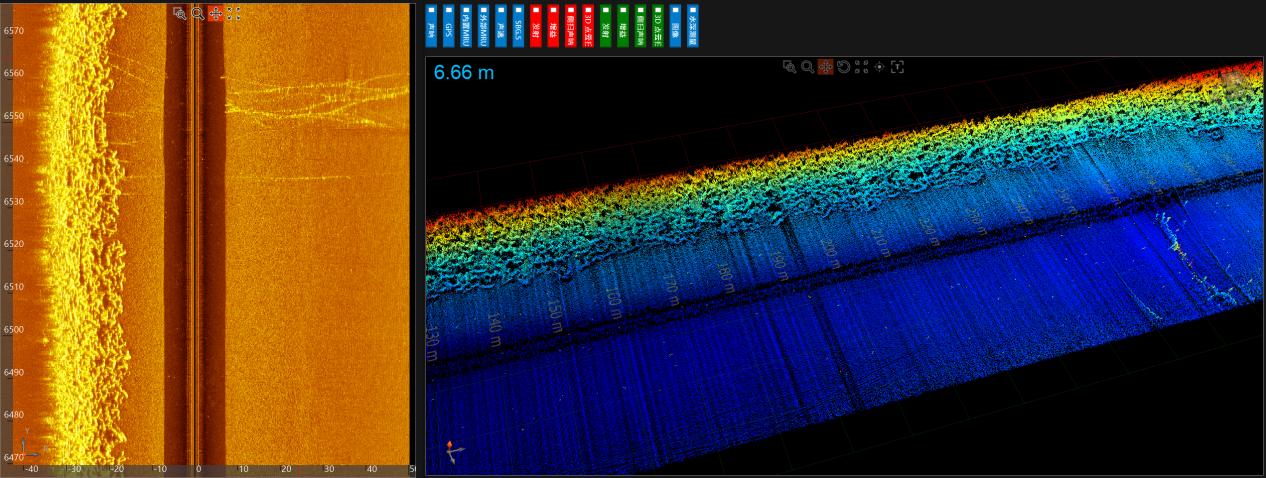
Breakwater survey – depth properties of breakwater blocks
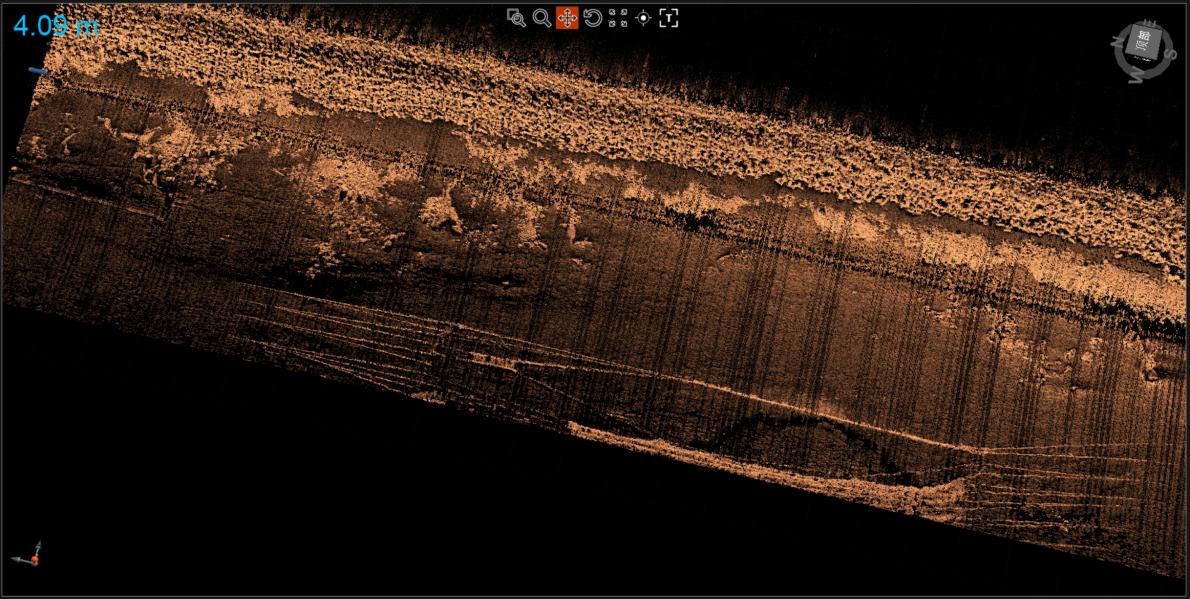
Breakwater survey – echo intensity of wave-dissipating blocks and fish farming cages
Breakwater survey - target tag
Breakwater survey - target tag
4. Data Examples
4.1 Data Examples of GeoScope SBP
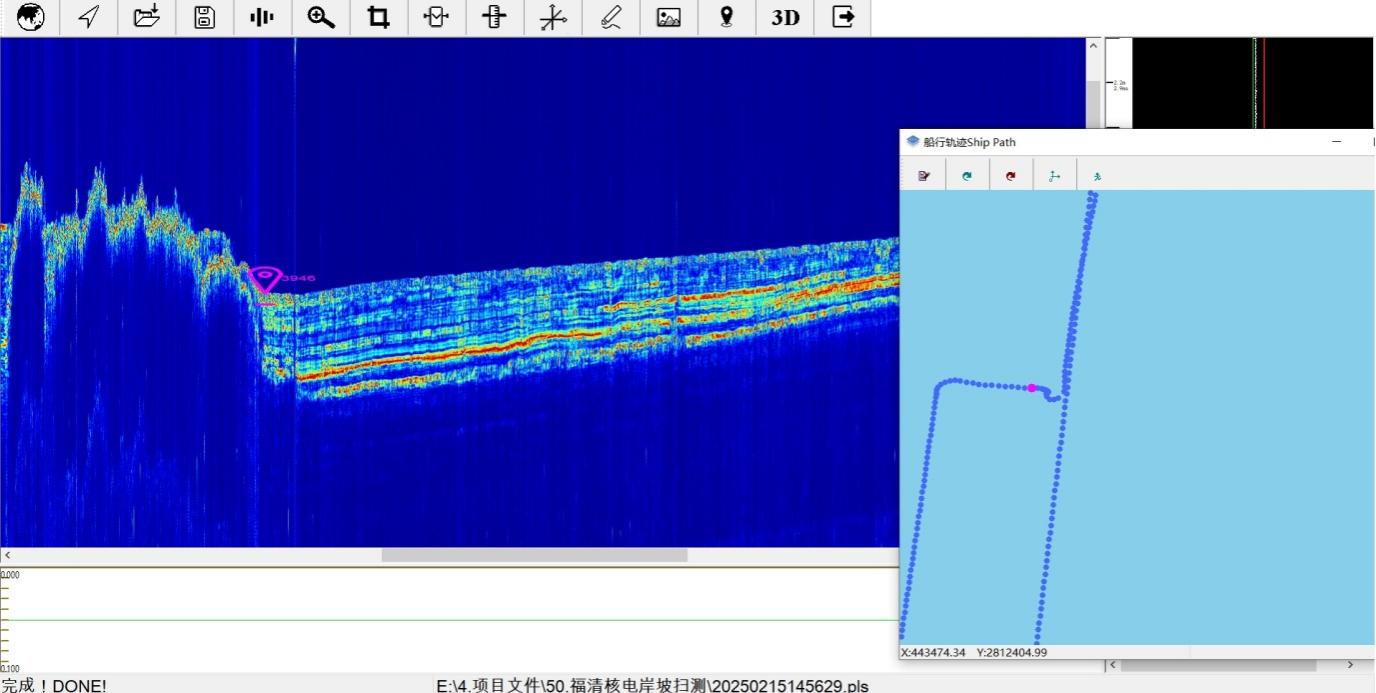
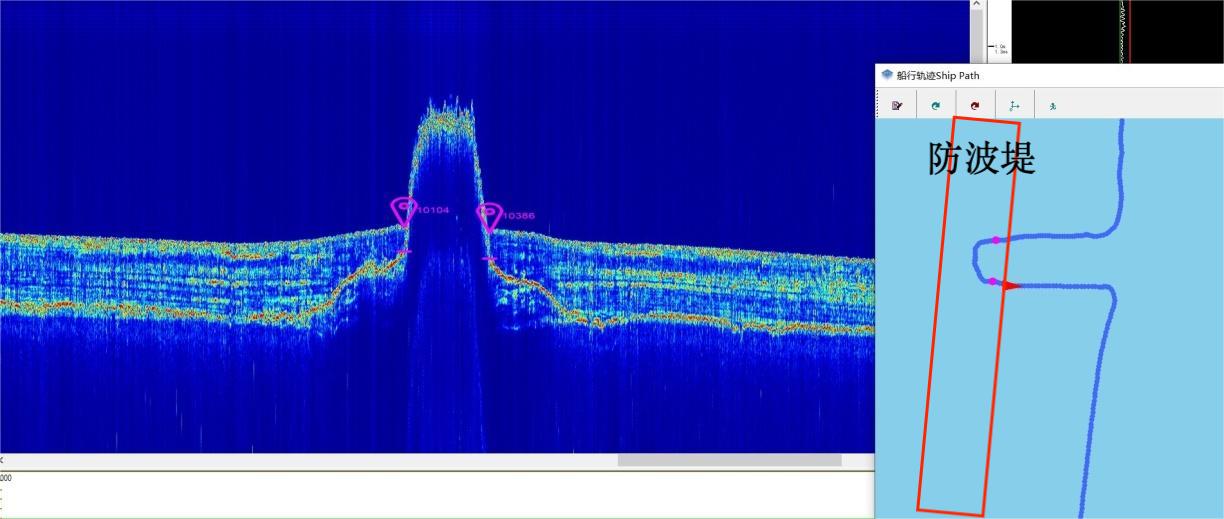
The USV was measured perpendicular to the breakwater. When approaching the breakwater, a fault in the silt was observed, and the penetration depth gradually decreased. It was judged that the starting coordinate position below the mud surface of the breakwater was issued to the user.
During the vertical survey process to and from the USV, the seabed gradually disappeared and structures that could not be penetrated appeared when approaching the breakwater. When moving away from the breakwater, the structures gradually sank and the seabed and corresponding penetrations appeared. The marked points in the figure correspond to the positions where underwater structures appear, that is, the positions of the breakwater below the seabed.
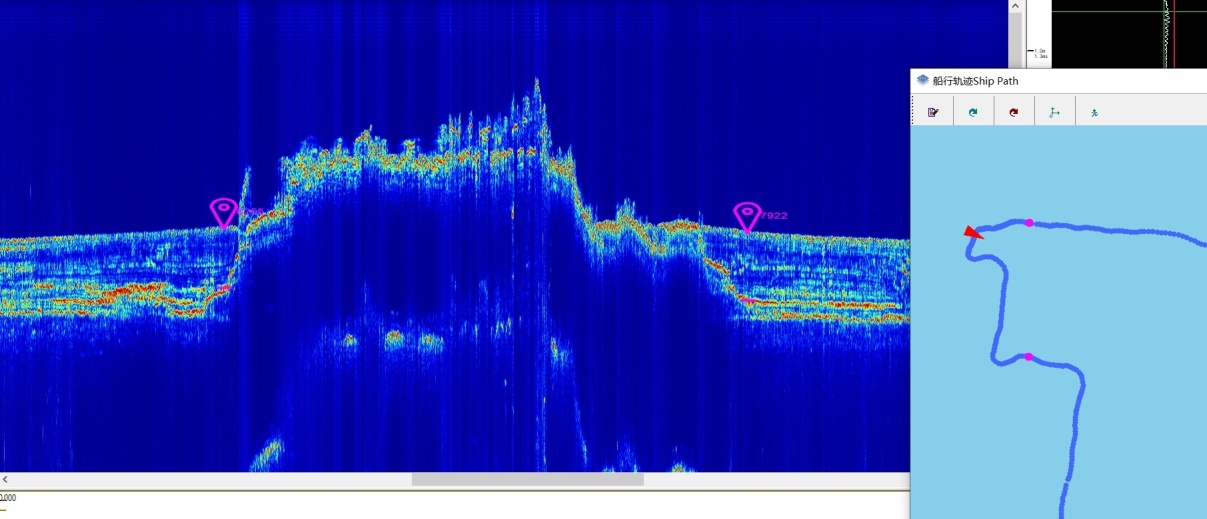
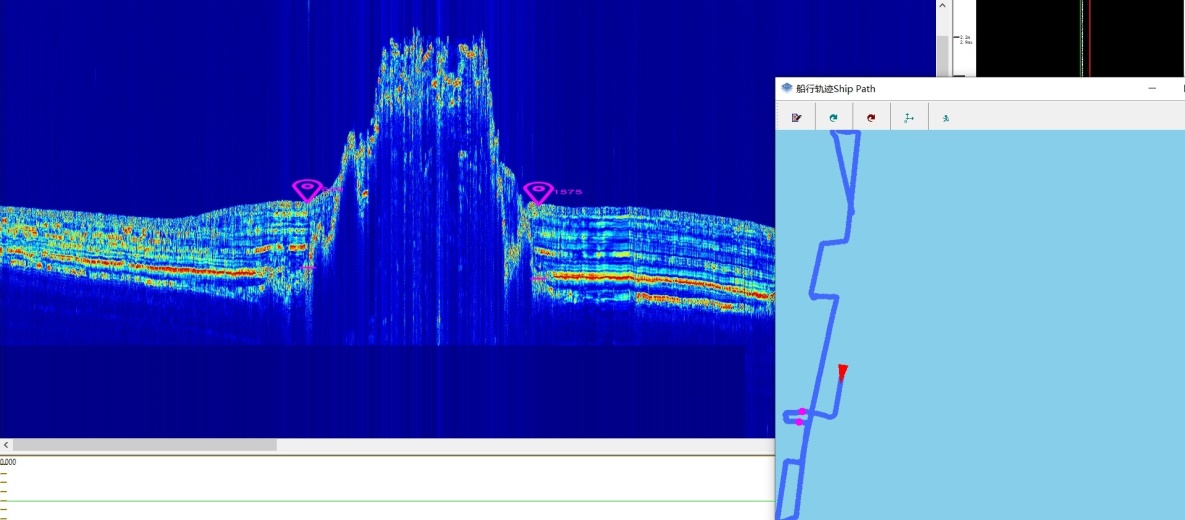
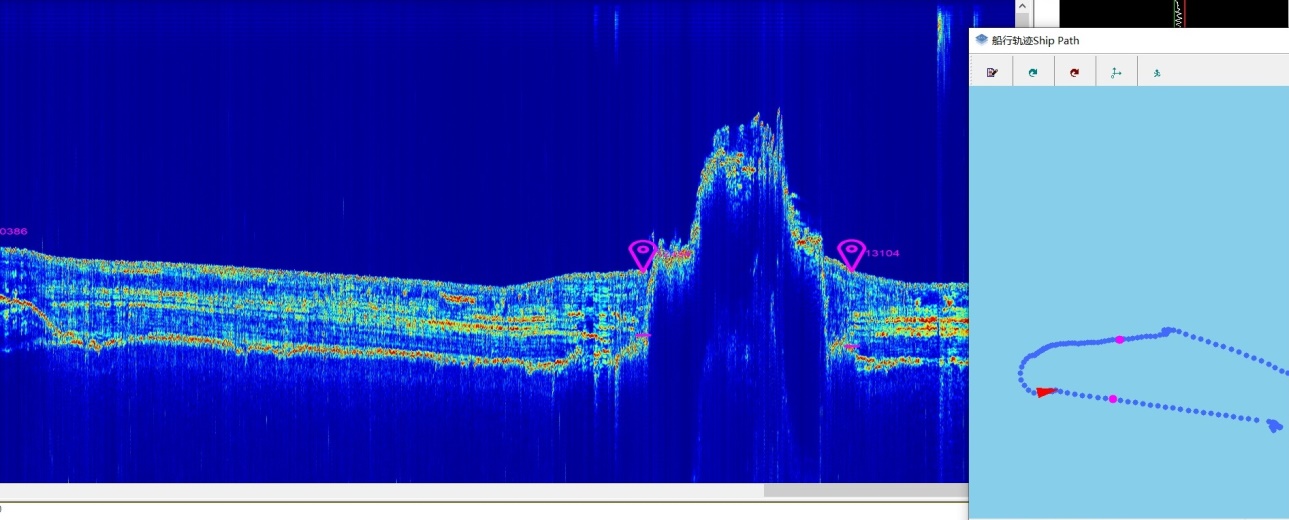
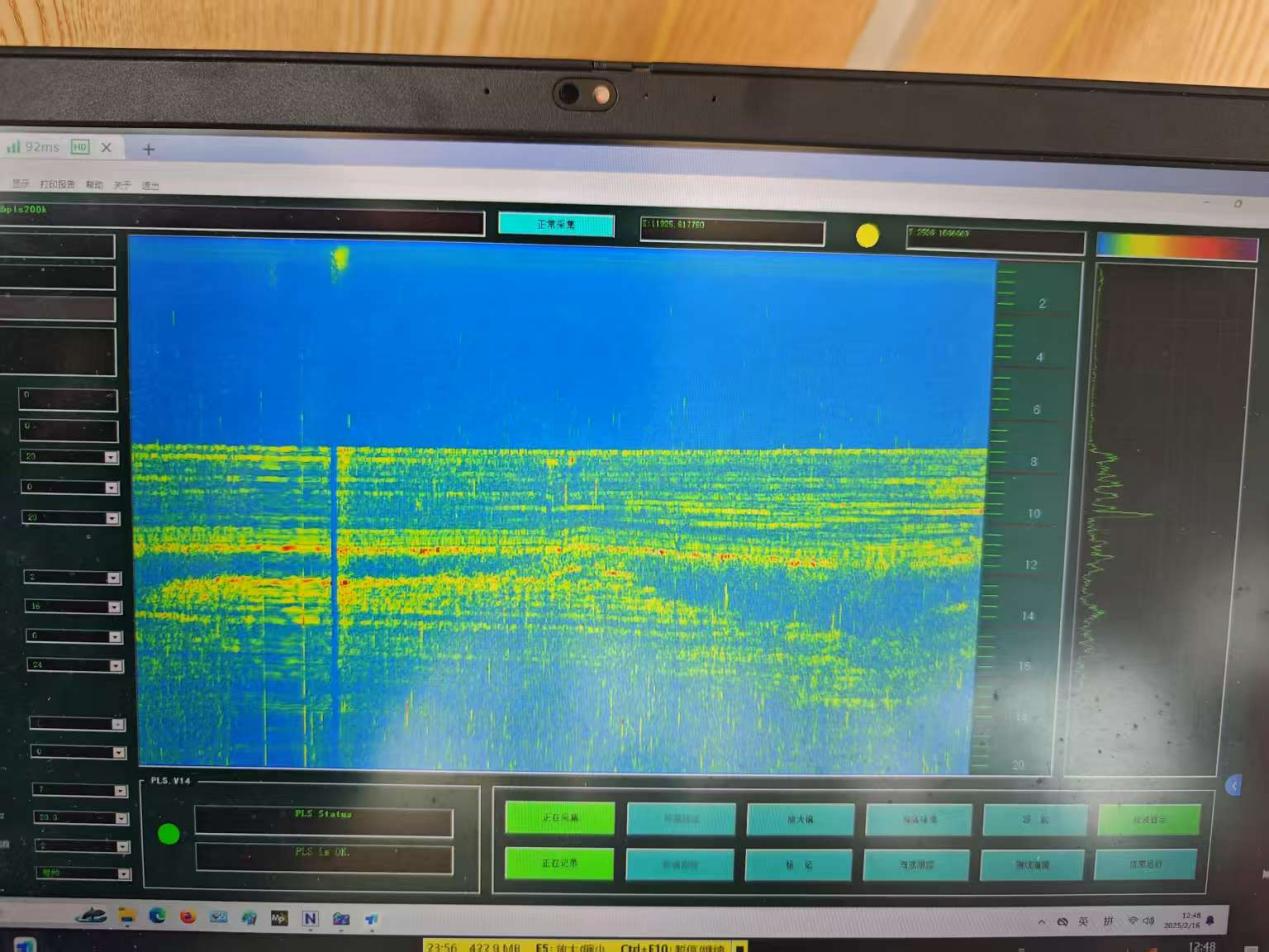
In addition, during the cruise, the GeoScope 200 acquired good layers in an area with a water depth of 7 m, and the penetration depth reached 10 m with clear layers.
4.2 Data Examples of Ping3DSS
The 3DSS-iDX-450 sonar features an integrated inertial navigation system and an integrated GNSS device to simplify installation, use and calibration. The sonar uses a multi-element SideScan transducer to achieve full-space scanning of the underwater environment, and a single measurement can complete the entire breakwater operation.
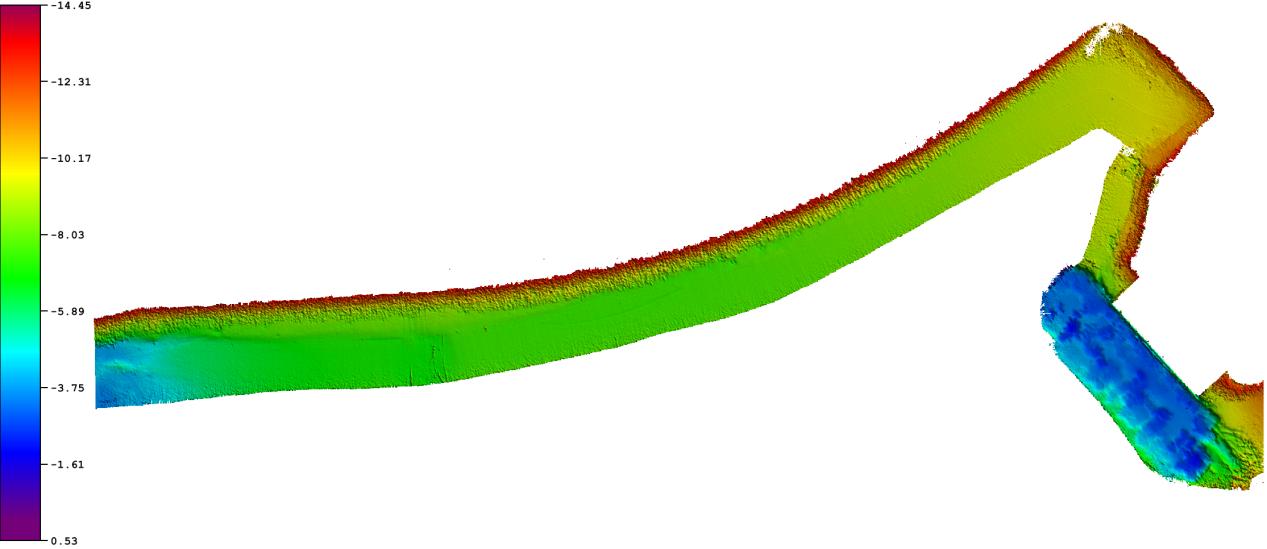
Data Example of 0.5m Grid
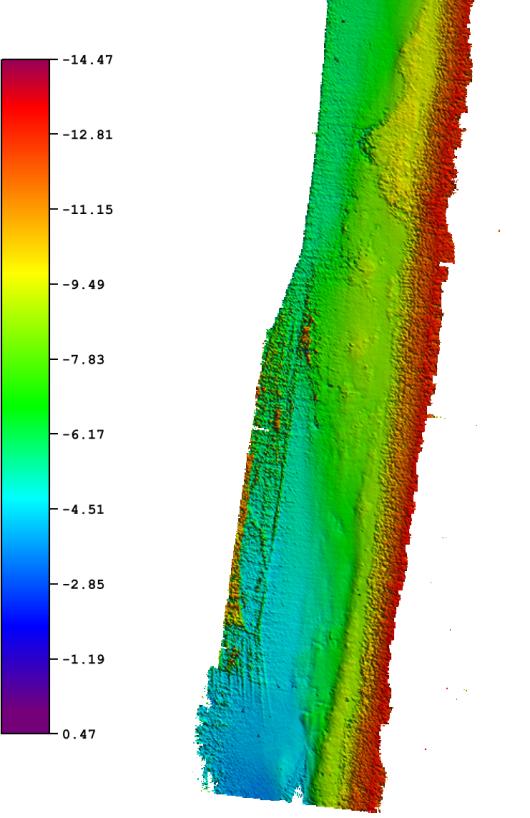
Data Example of 0.5m Grid
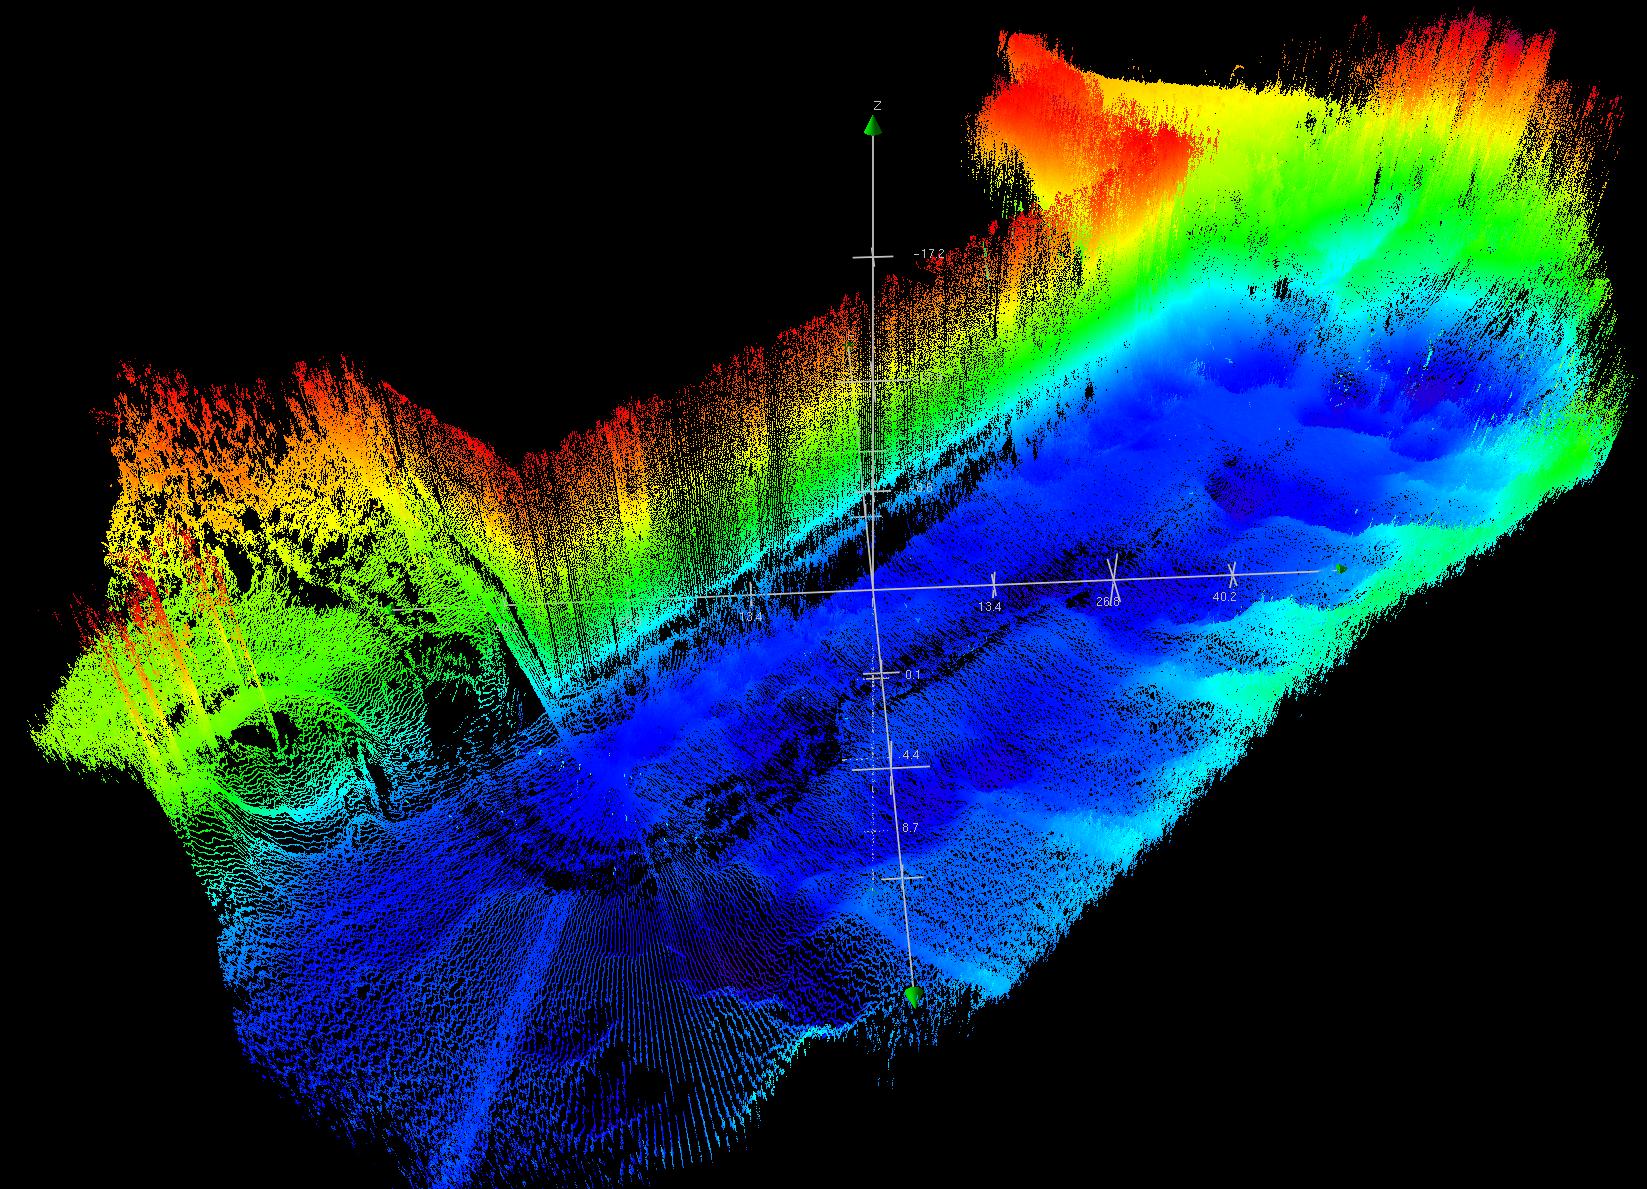
3D Point Cloud of the dock
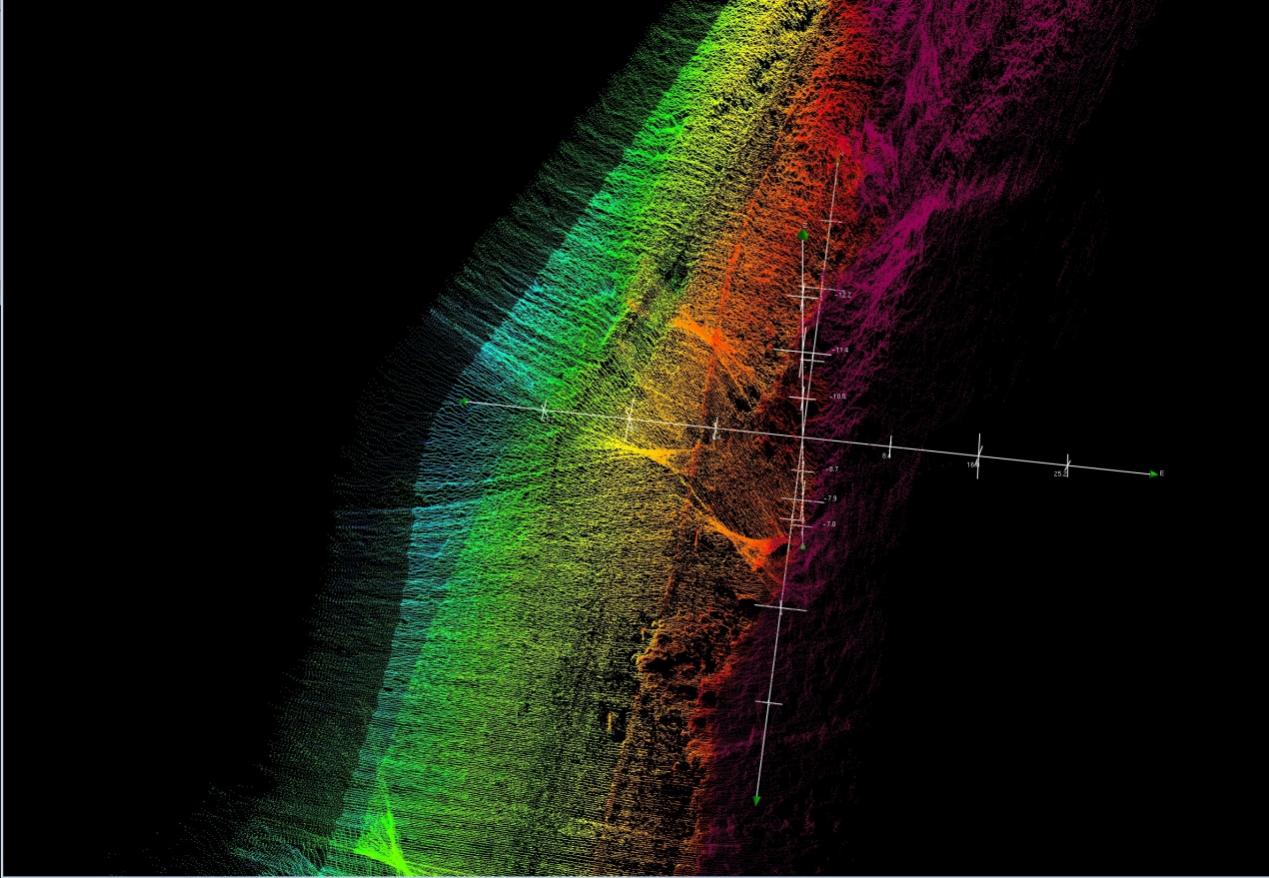
3D Point Cloud of the dock
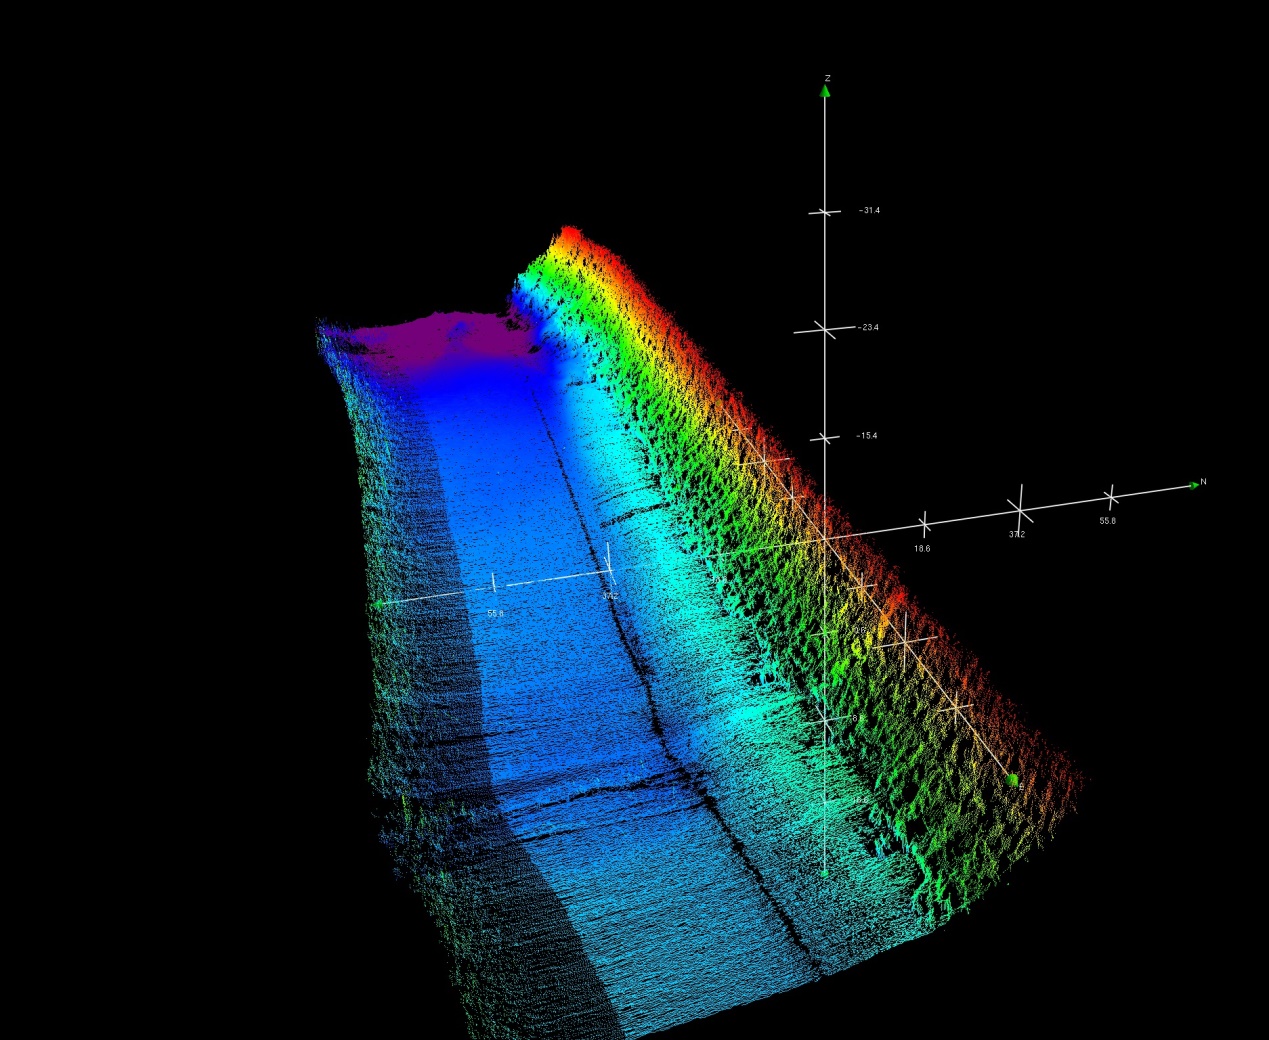
3D Point Cloud of the cage-type net
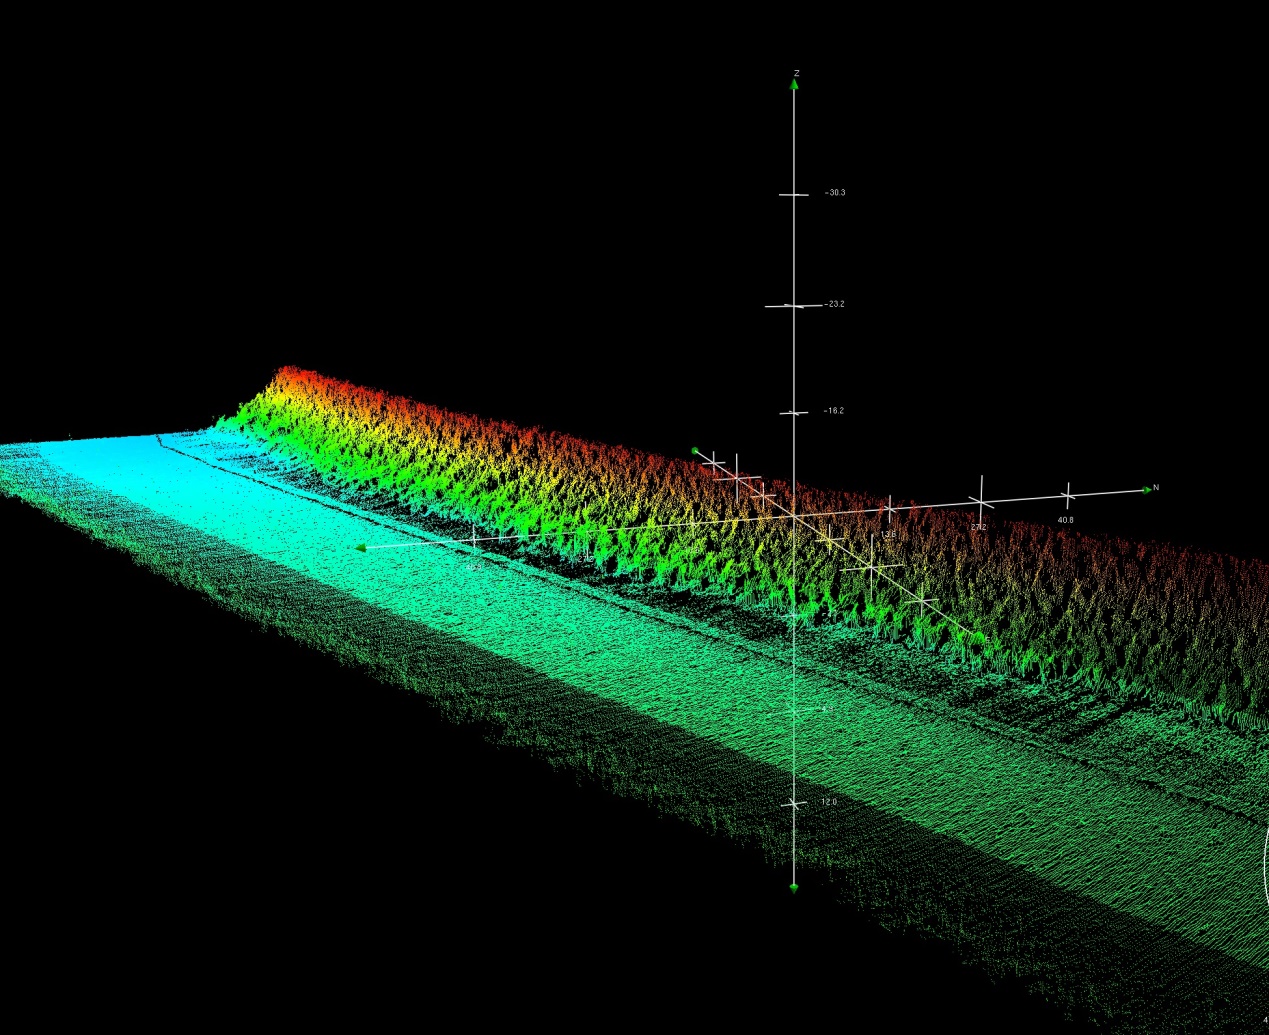
3D Point Cloud of the breakwater

