Parametric Sub-Bottom Profiler Field Trial: Channel Cross-Section Surveys in the Yellow River
2026-07-29
Products:OPT parametric sub-bottom profiler (portable all-in-one)
Date:July 2026
Location:Hydrological stations, middle reaches of the Yellow River
Installation:Vessel side-mount & USV integration
Suspended sediment concentration 60–204 kg/m³
In July 2026, Ocean Physics conducted a three-day field trial of its independently developed parametric sub-bottom profiler at hydrological stations on the middle reaches of the Yellow River, during the annual water-sediment regulation period. The trial covered two deployment modes — vessel side-mount and USV (unmanned surface vehicle) integration — and focused on verifying depth-sounding capability and data stability under extreme suspended sediment concentrations (SSC) of 60–204 kg/m³.
The Instrument
A parametric sub-bottom profiler works on the principle of nonlinear acoustics. The transducer simultaneously transmits two high-frequency signals at closely spaced frequencies (f₁, f₂). As the waves propagate, the nonlinearity of the water medium generates a difference-frequency wave |f₁−f₂|. Because the two primary frequencies are close, the difference frequency can be as low as a few kilohertz, providing strong penetration into sediment layers — while the high primary frequencies allow a compact transducer that is easy to install and integrate. The difference-frequency beam is free of sidelobes, with excellent directivity and high spatial resolution.
The unit used in this trial is a portable, all-in-one design supporting both side-mount and USV deployment, supplied with sonar acquisition and data-processing software.
Key Specifications
| Parameter | Specification |
| Primary frequency | 85–115 kHz |
| Secondary (difference) frequency | 5–25 kHz |
| Pulse length | 0.05–1 ms |
| Pulse type | CW / Chirp selectable |
| Ping rate | up to 20 ping/s |
| Primary beam width | ~5° |
| Secondary beam width | 5–6° |
| Primary source level | ≥238 dB re 1 μPa @ 1 m (100 kHz) |
| Secondary source level | ≥194 dB re 1 μPa @ 1 m (20 kHz) |
| Dynamic range | ≥110 dB |
| Range resolution | ≤4 cm |
| Penetration | up to 40 m (depending on sediment type and ambient noise) |
| Operating range | up to 200 m |
| Motion compensation | heave correction supported |
| Power supply | 24 VDC / 220 VAC to 24 VDC |
| External interfaces | GPS, motion sensor |
Field Tests
The campaign ran in two phases: Phase 1 at Hydrological Station A with a vessel side-mount, testing sounding performance at peak sediment concentrations during the flushing period; Phase 2 at Hydrological Station B on a USV, with joint deployment alongside an ADCP.
Station A: Side-Mount, High-Sediment Testing
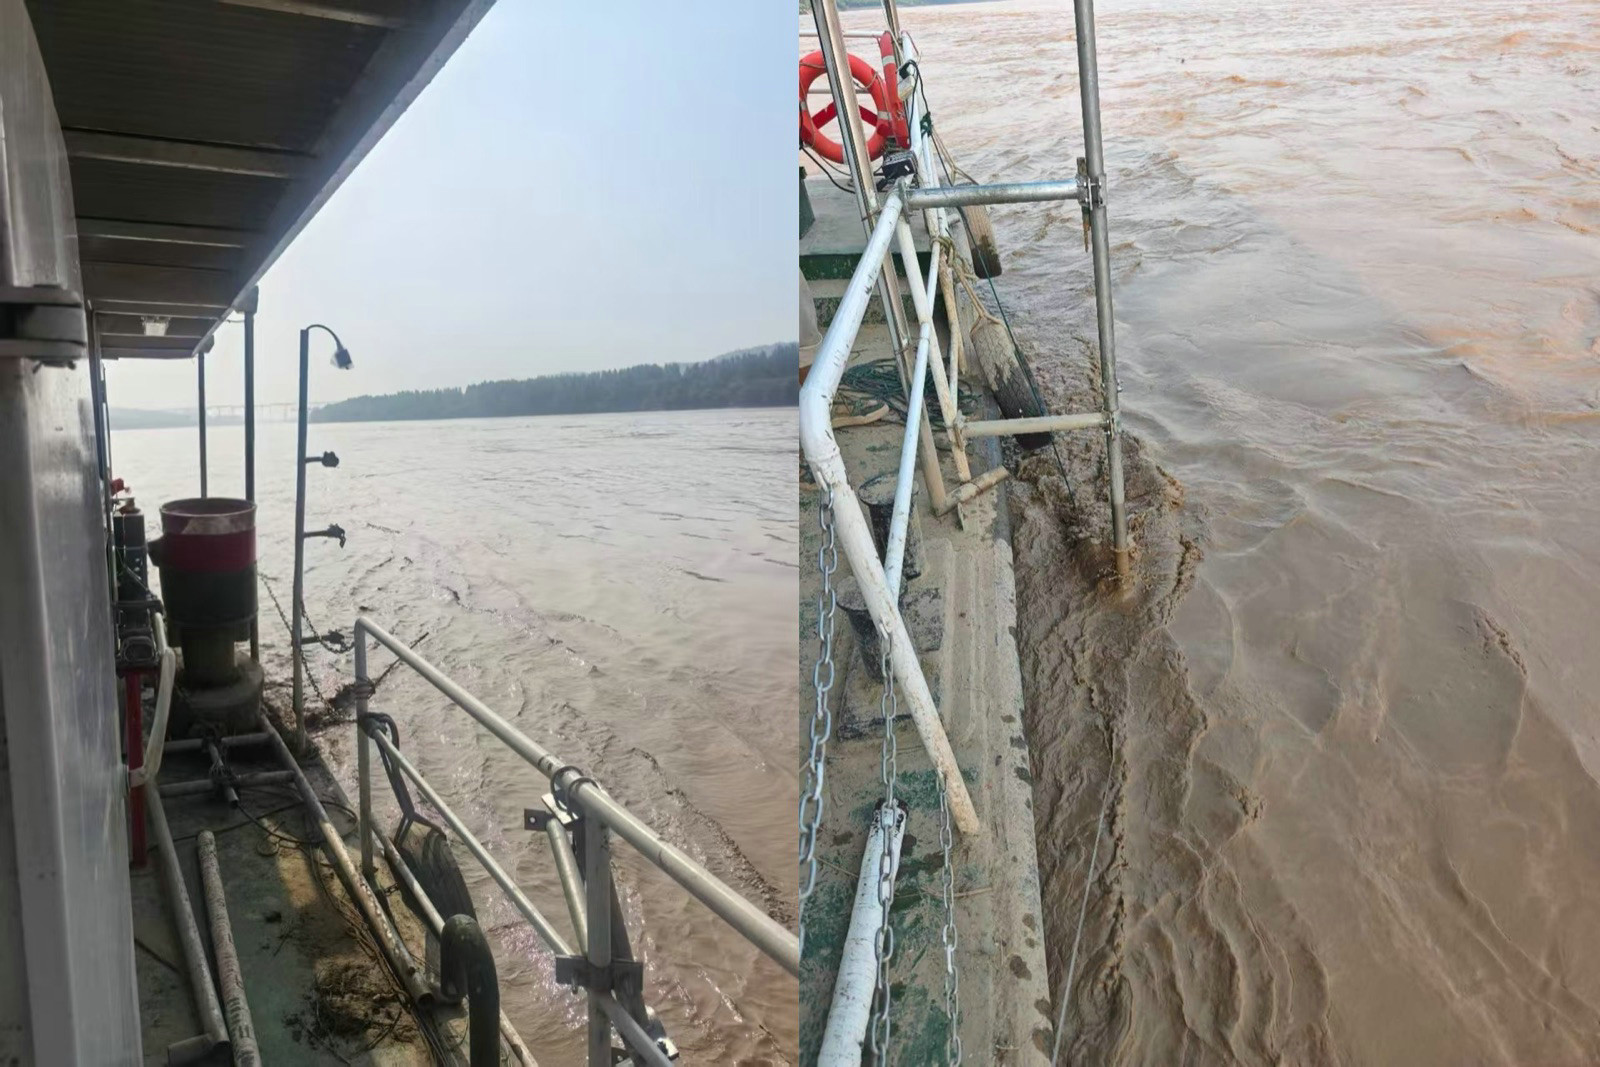
[Fig. 1 — Side-mount installation and the sediment-laden river]
[Fig. 2 — Installation detail]
The unit was mounted on the starboard side of the survey vessel via a rigid bracket, secured with bow, stern, and under-hull lines, with the transducer at approximately 1 m draft.
Fixed-point measurements at the dock — July 7, 09:13, SSC 165 kg/m³, current 2–3 m/s. Dock-side comparison: sounding pole 3.7 m vs. instrument reading 3.9 m — in good agreement.
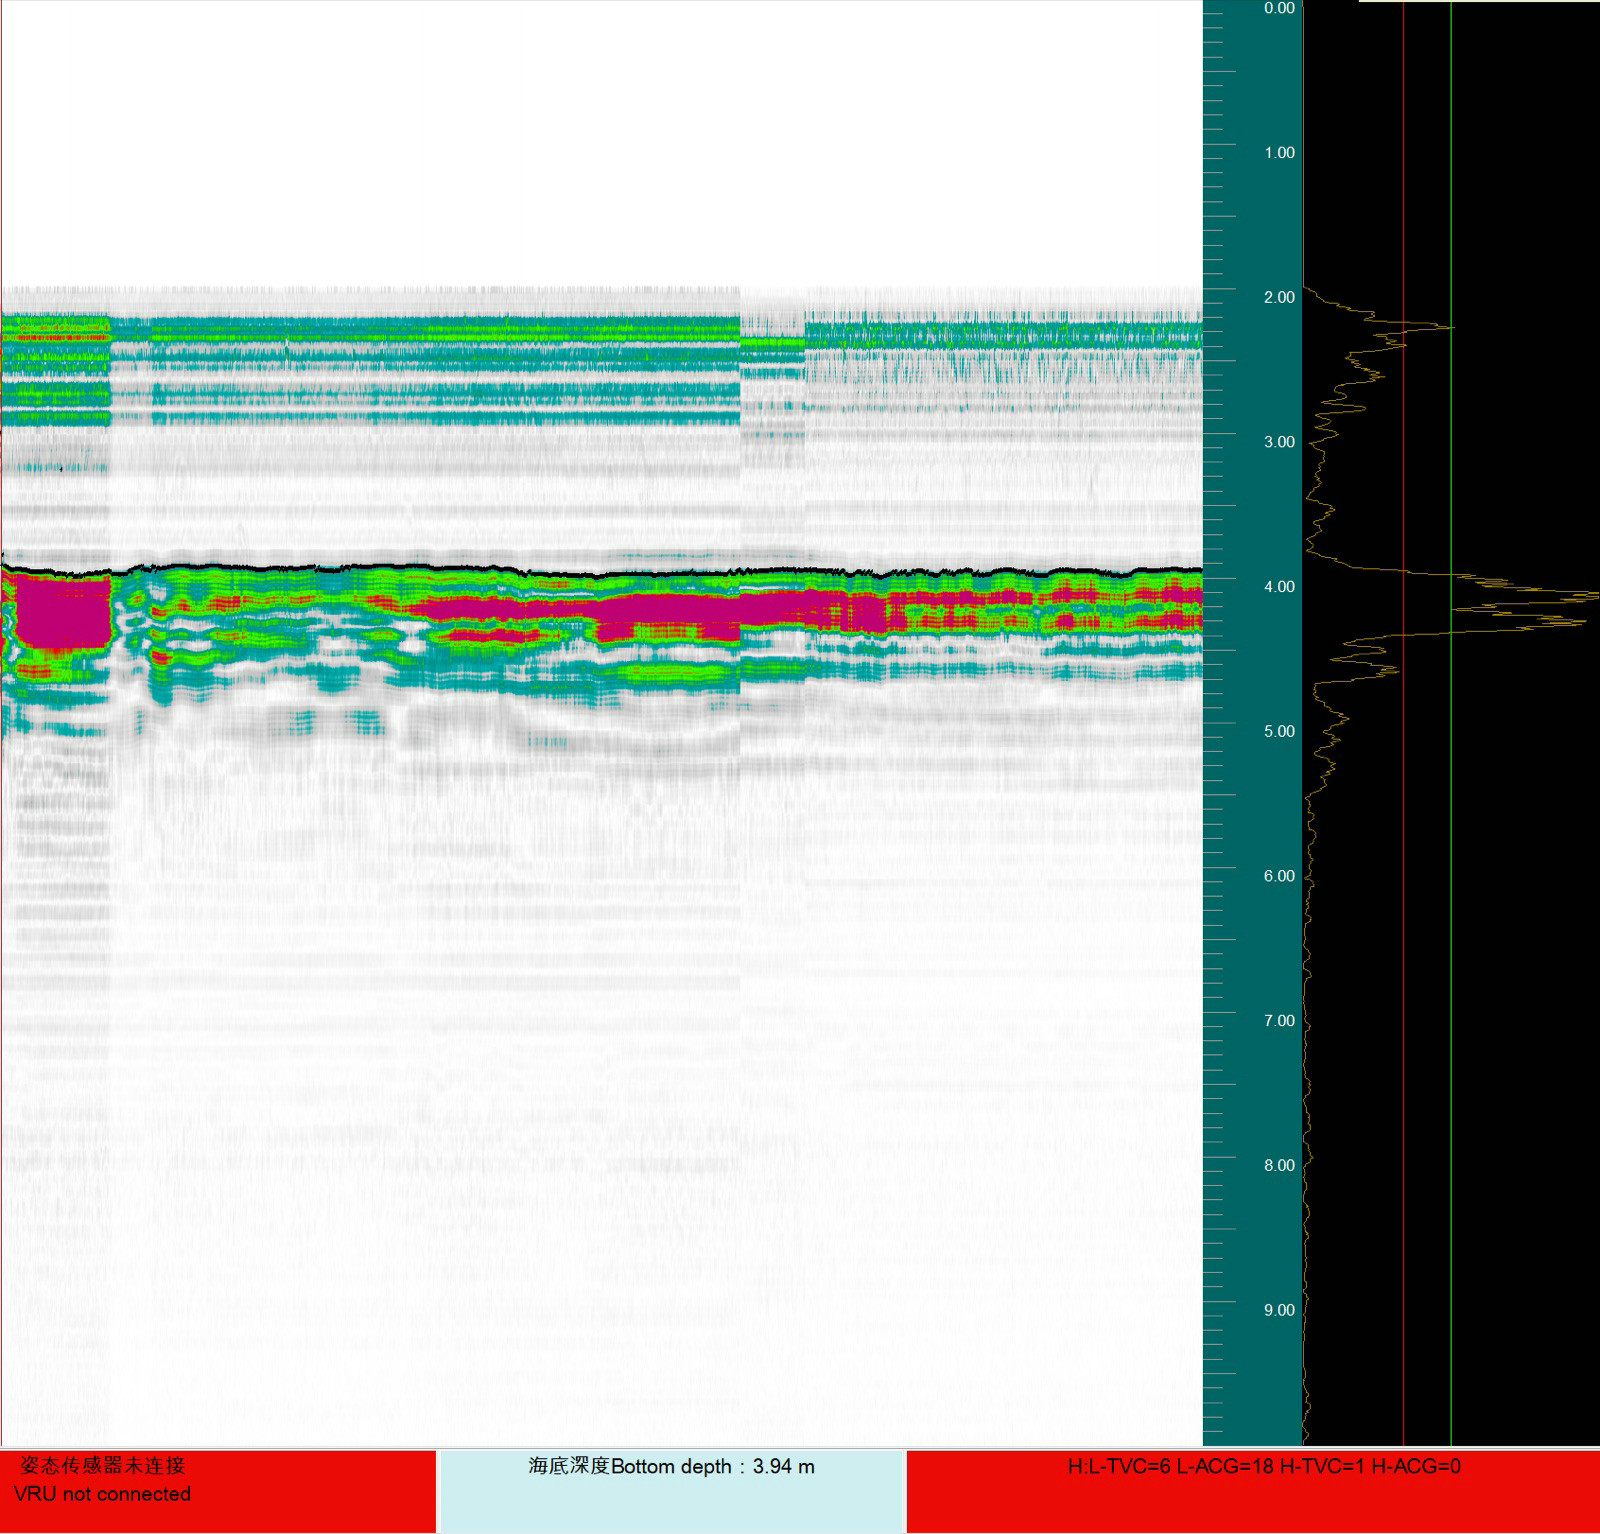
[Fig. 4 — Fixed-point measurement at the dock]
Channel cross-section survey — July 7, 10:43, SSC 170 kg/m³. Outbound and return cross-section lines were completed; the profiles imaged clearly, with riverbed topography readily distinguishable.
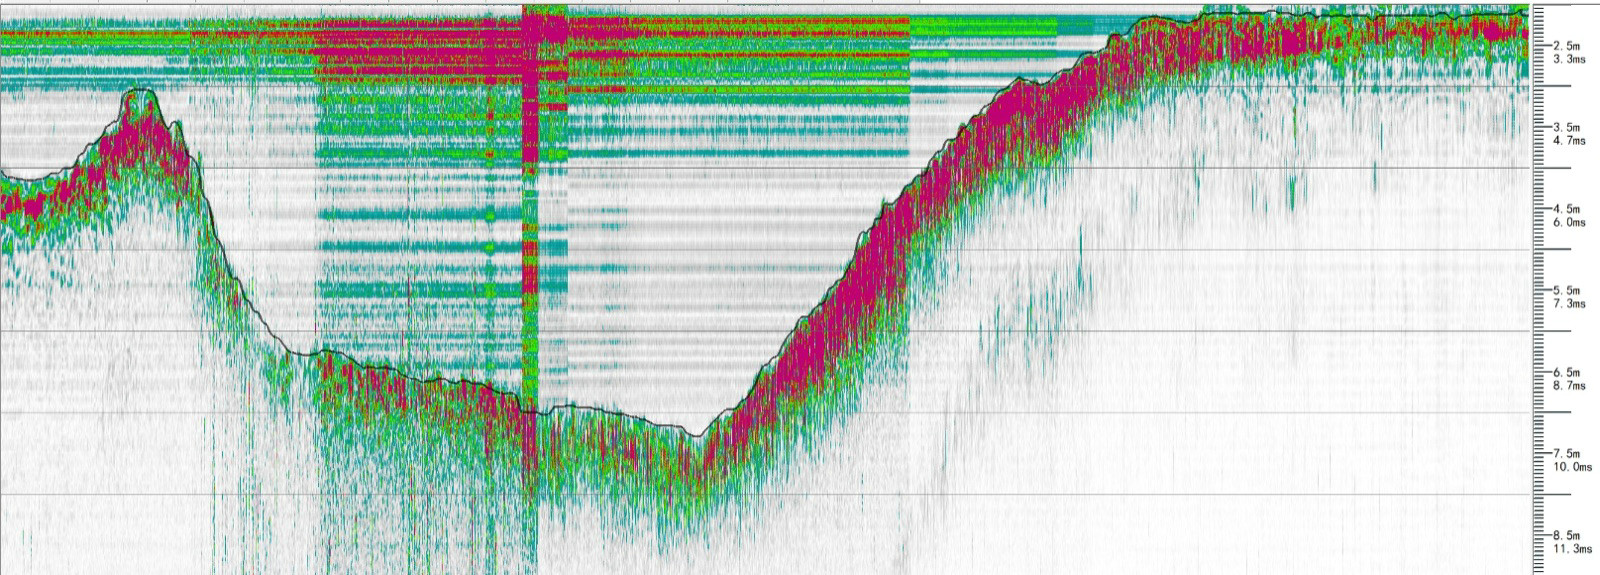
[Fig. 5 — Outbound cross-section]
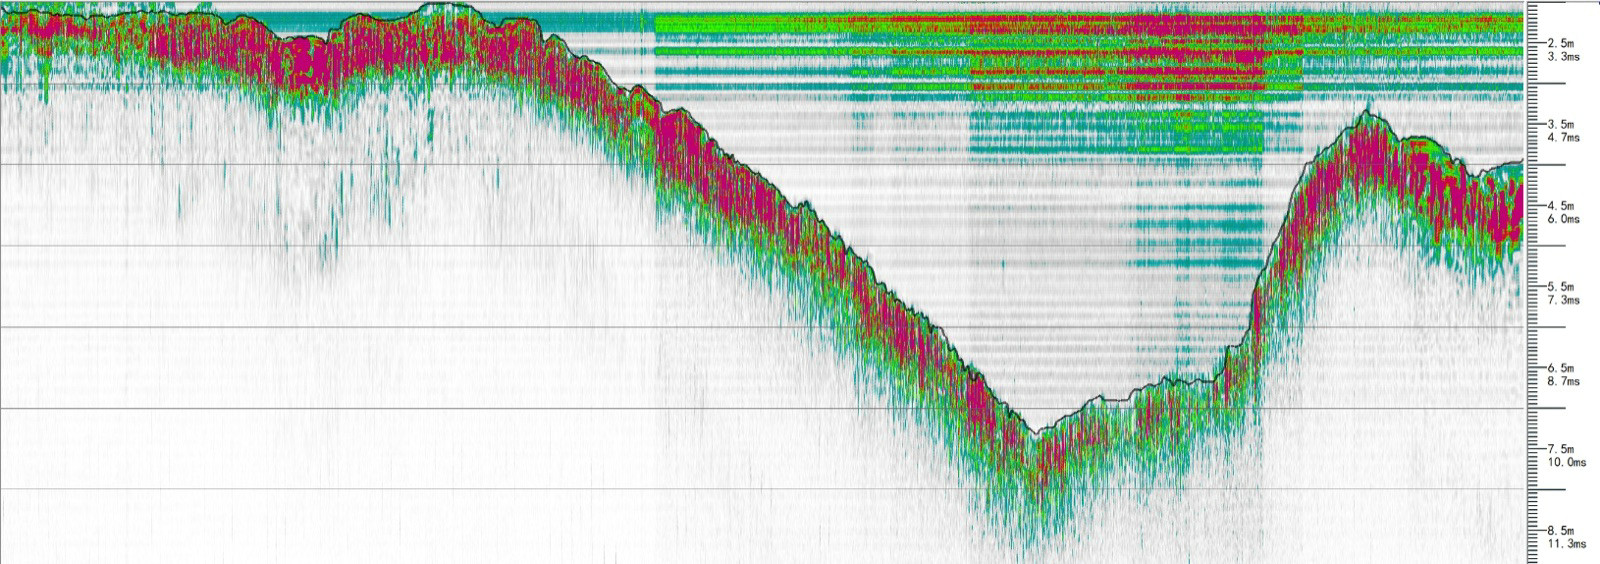
[Fig. 6 — Return cross-section]
Fixed-point comparisons along the channel — From 11:17, comparative soundings were taken at multiple stations: at dock station 1, sounding pole 4.1 m vs. instrument 4.2 m; at station 2 (vessel stopped), the instrument recorded pronounced depth variation, reflecting complex riverbed relief. Comparisons across stations were completed by 13:00. Overall, instrument depths read 20–40 cm deeper than the sounding-weight (lead fish) values — the weight was deployed ~5 m upstream of the instrument, so the offset partly reflects spatial separation; instrument readings agreed more closely with co-located sounding-pole measurements.
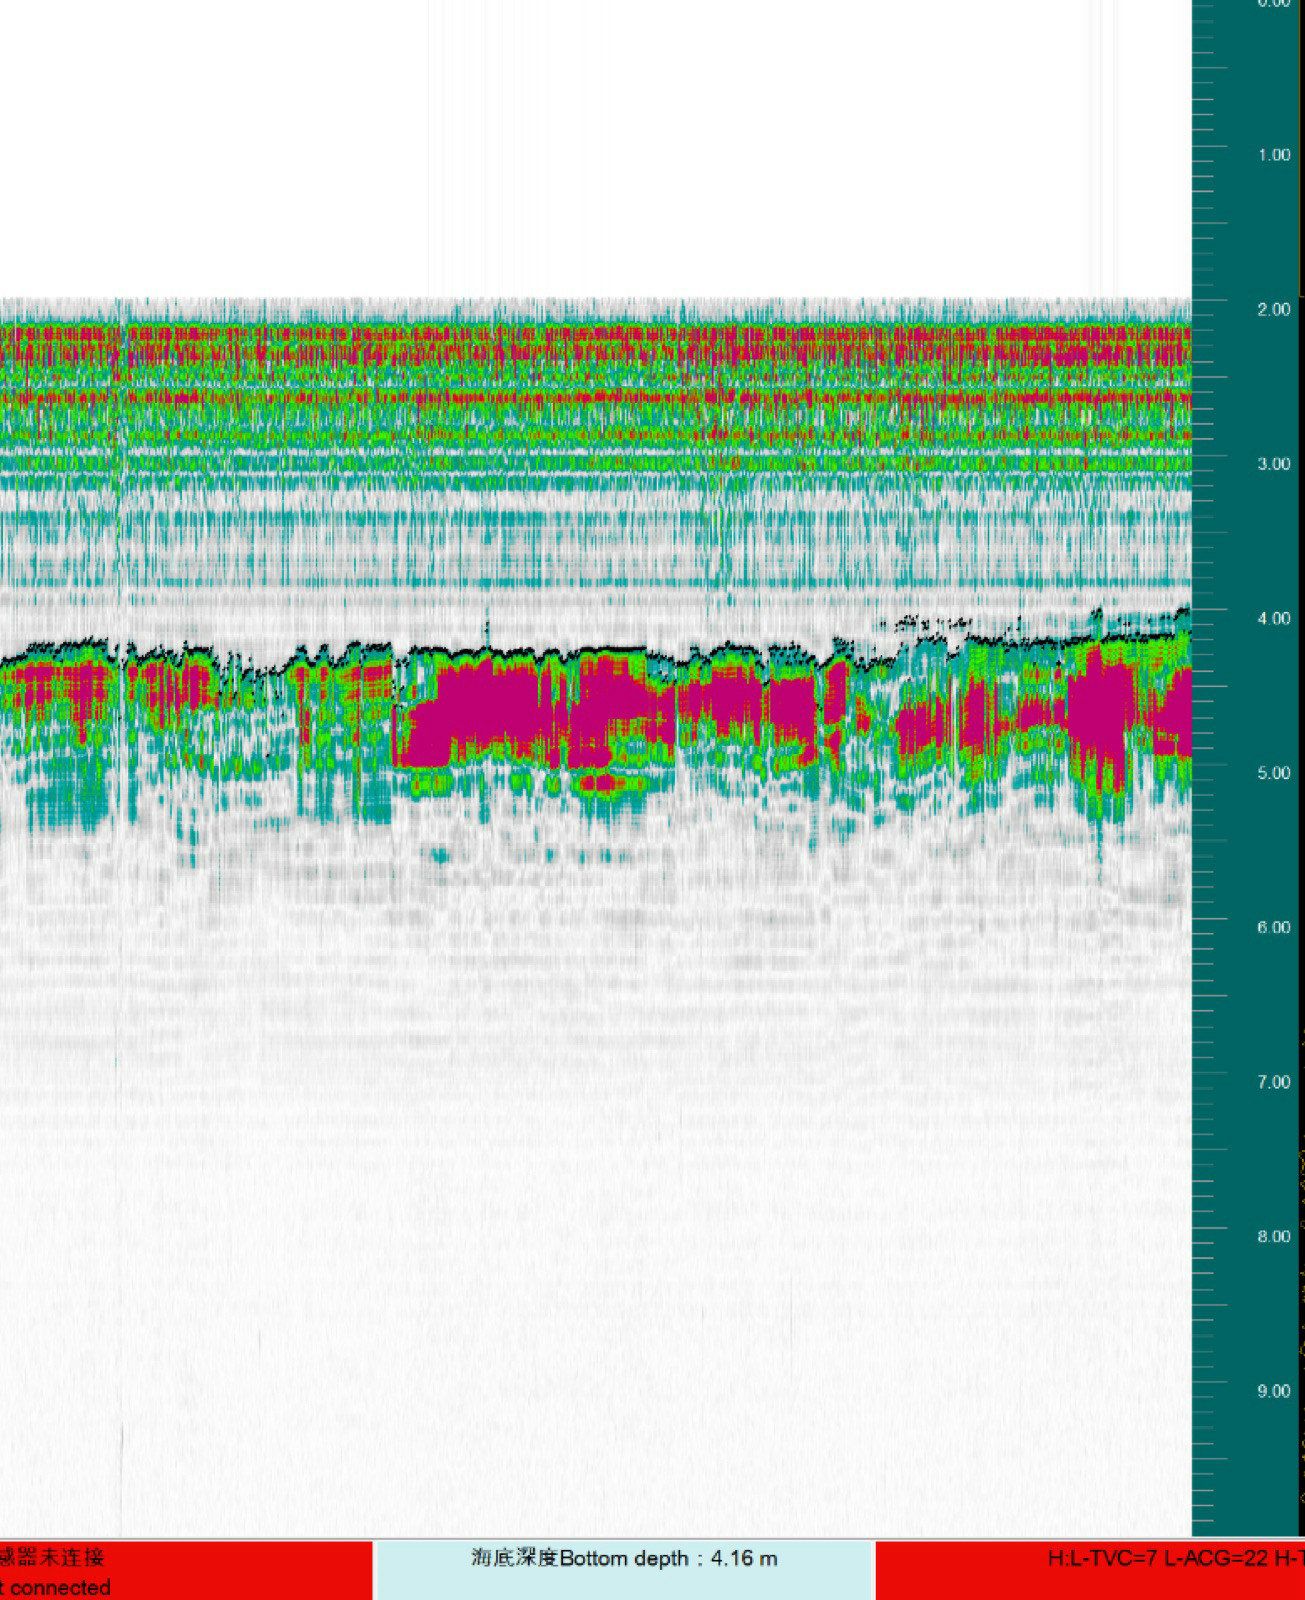
[Fig. 7 — Station 1 measurement display]
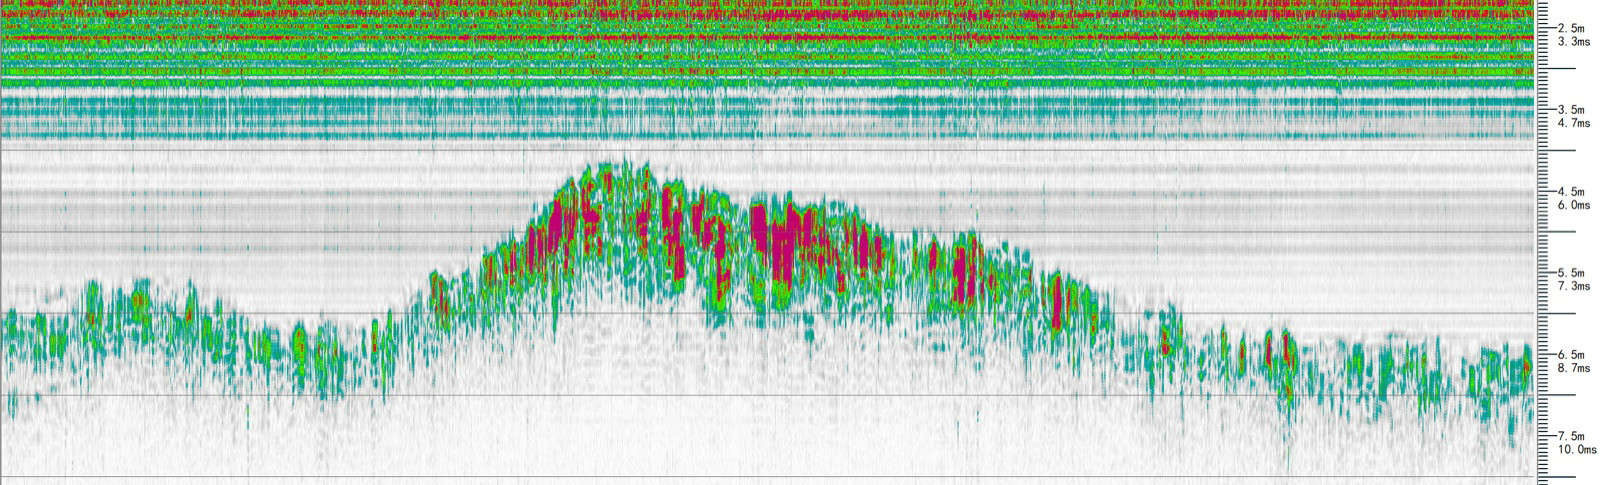
[Fig. 8 — Station 2 depth variation]
Underway survey — July 7, 17:54, SSC down to 80 kg/m³. A continuous underway survey was run in coordination with the station's sampling operations, returning to dock at 19:00 to complete the day's program.
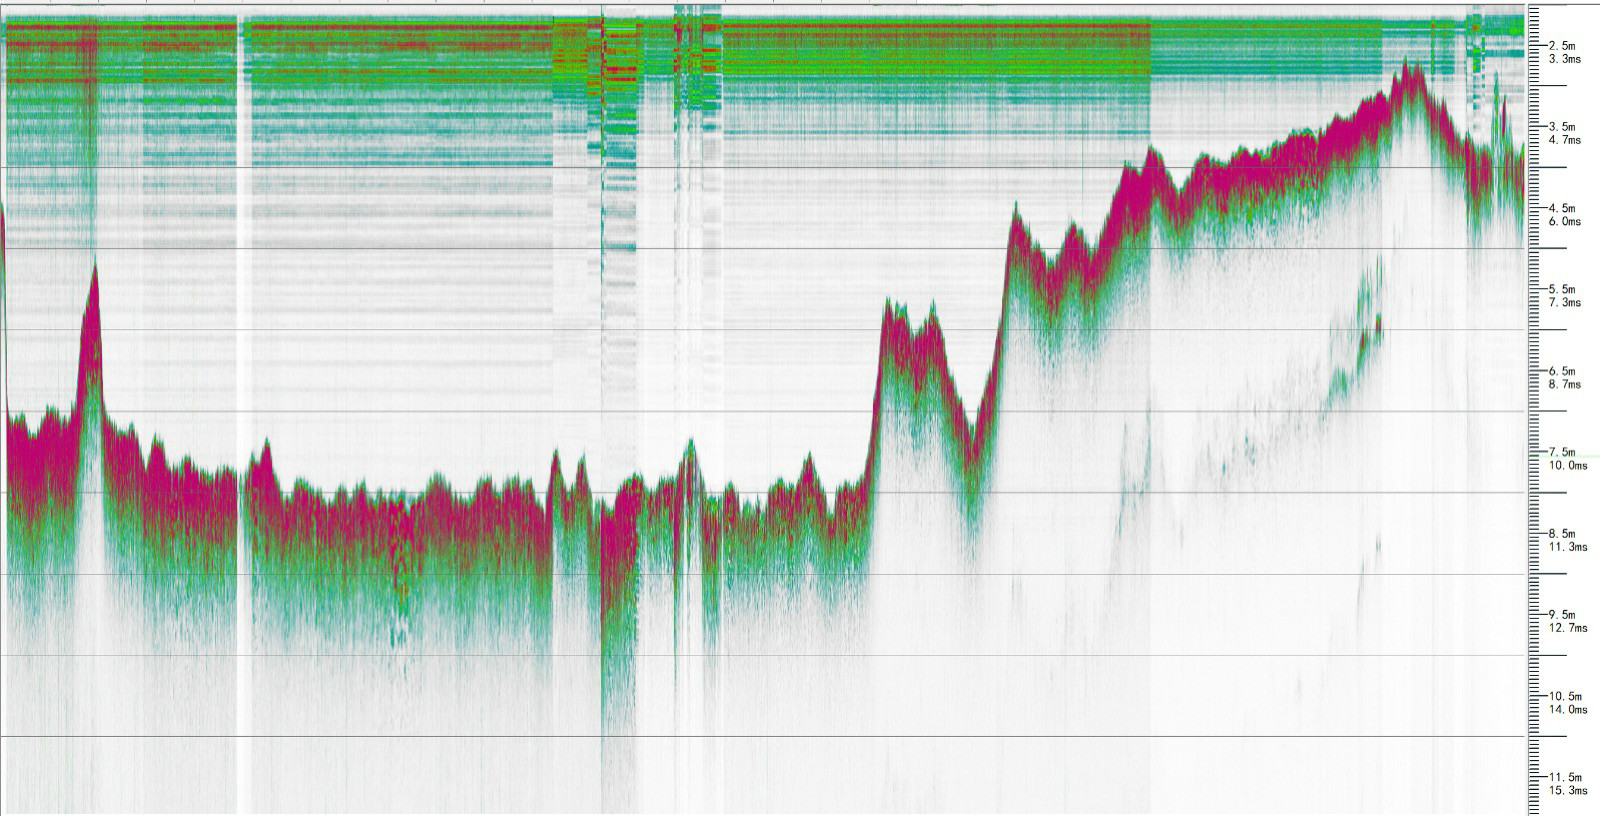
[Fig. 11 — Underway survey composite profile]
Day-one summary: At extreme concentrations of 165–170 kg/m³, bottom returns remained clear and stable in both fixed-point and underway modes, with performance headroom to spare. The 10 kHz secondary frequency performed best; in Chirp mode, the 8–12 kHz band was optimal, with effectiveness falling off quickly outside that range.
July 8 — fixed-point measurements — Transducer draft 97 cm, SSC 204 kg/m³, discharge 2,700 m³/s. Moored reading 4.56 m vs. sounding pole 4.3 m, a difference of ~26 cm. As SSC fell from 204 to 80 kg/m³ through the day, the instrument consistently acquired valid returns across successive measurement sessions, all with clear cross-section imaging.
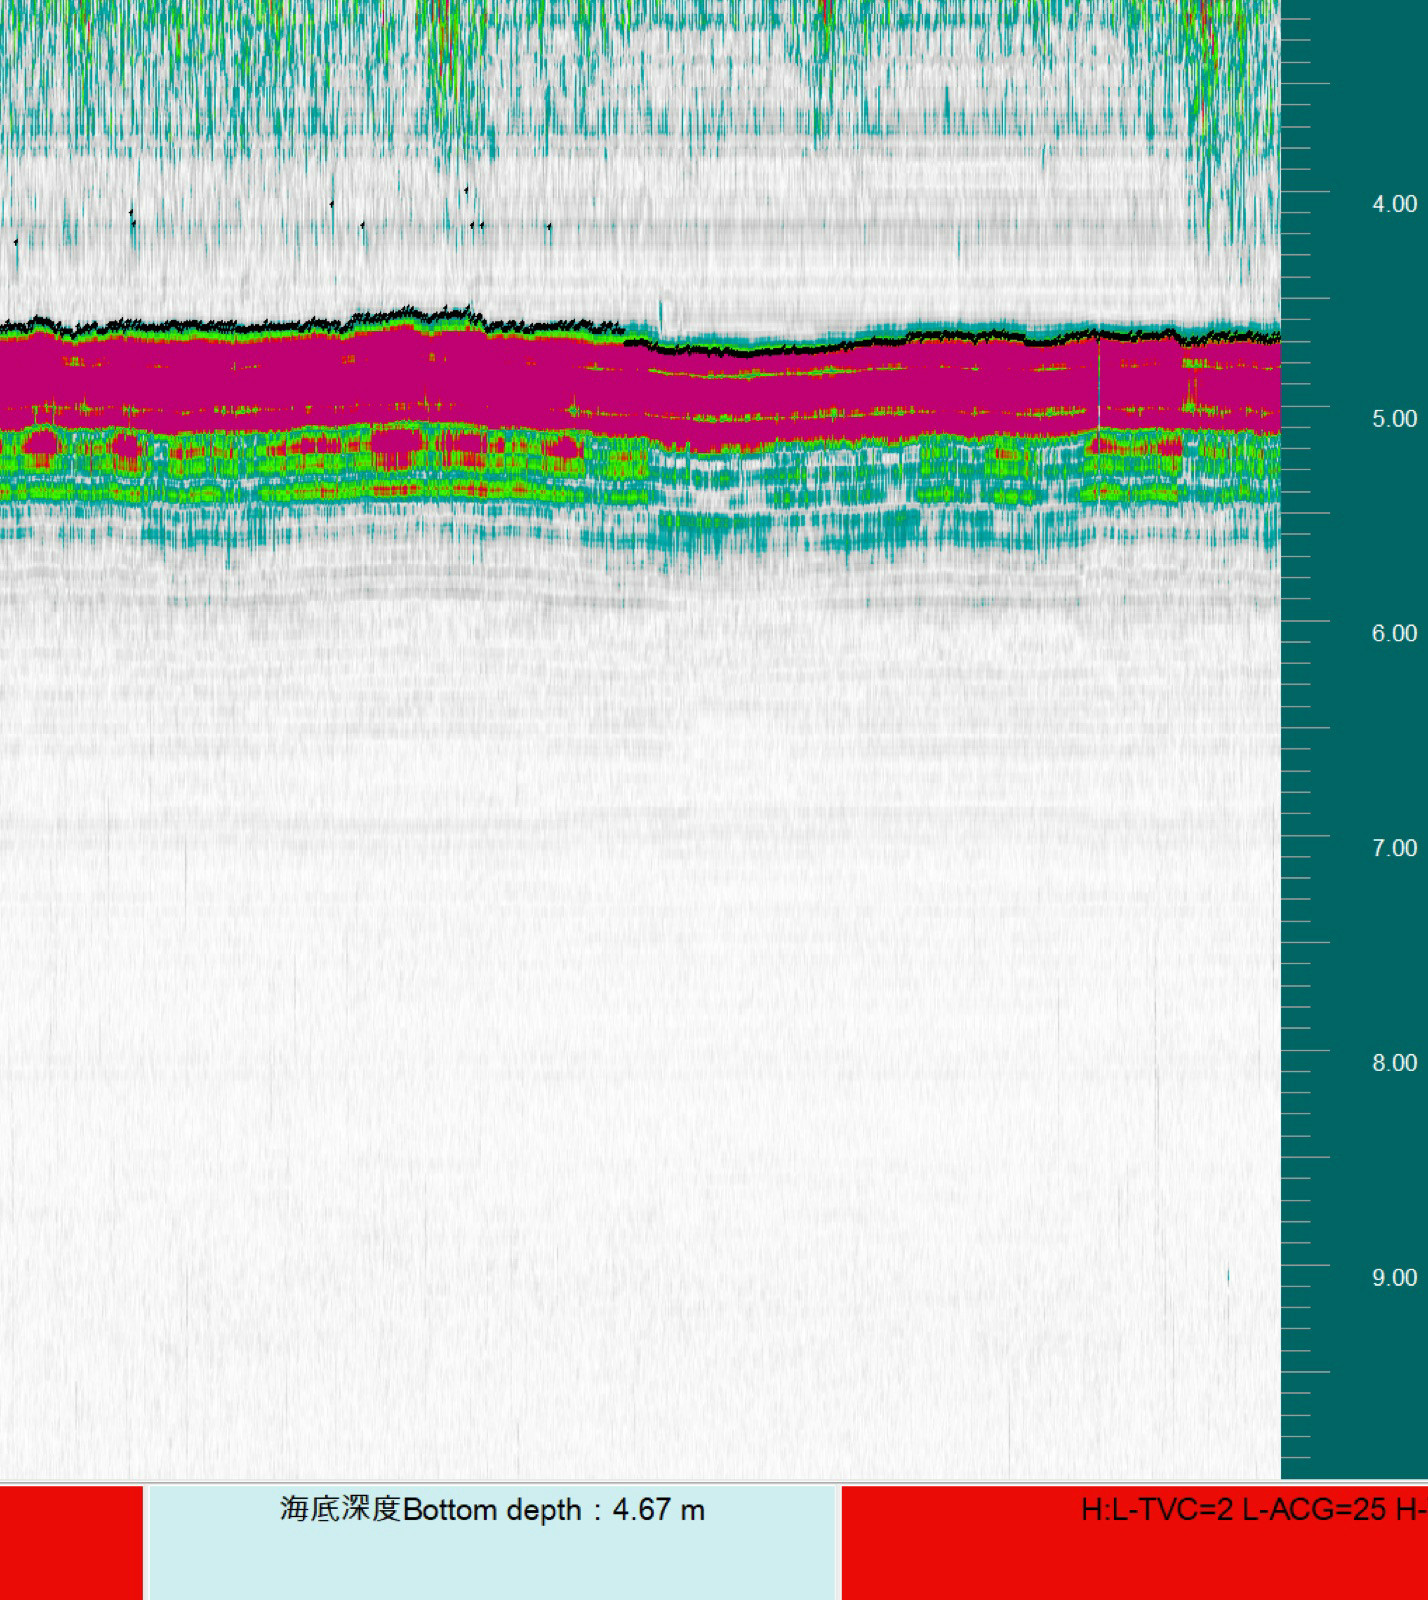
[Fig. 13 — Moored recording at SSC 204 kg/m³]
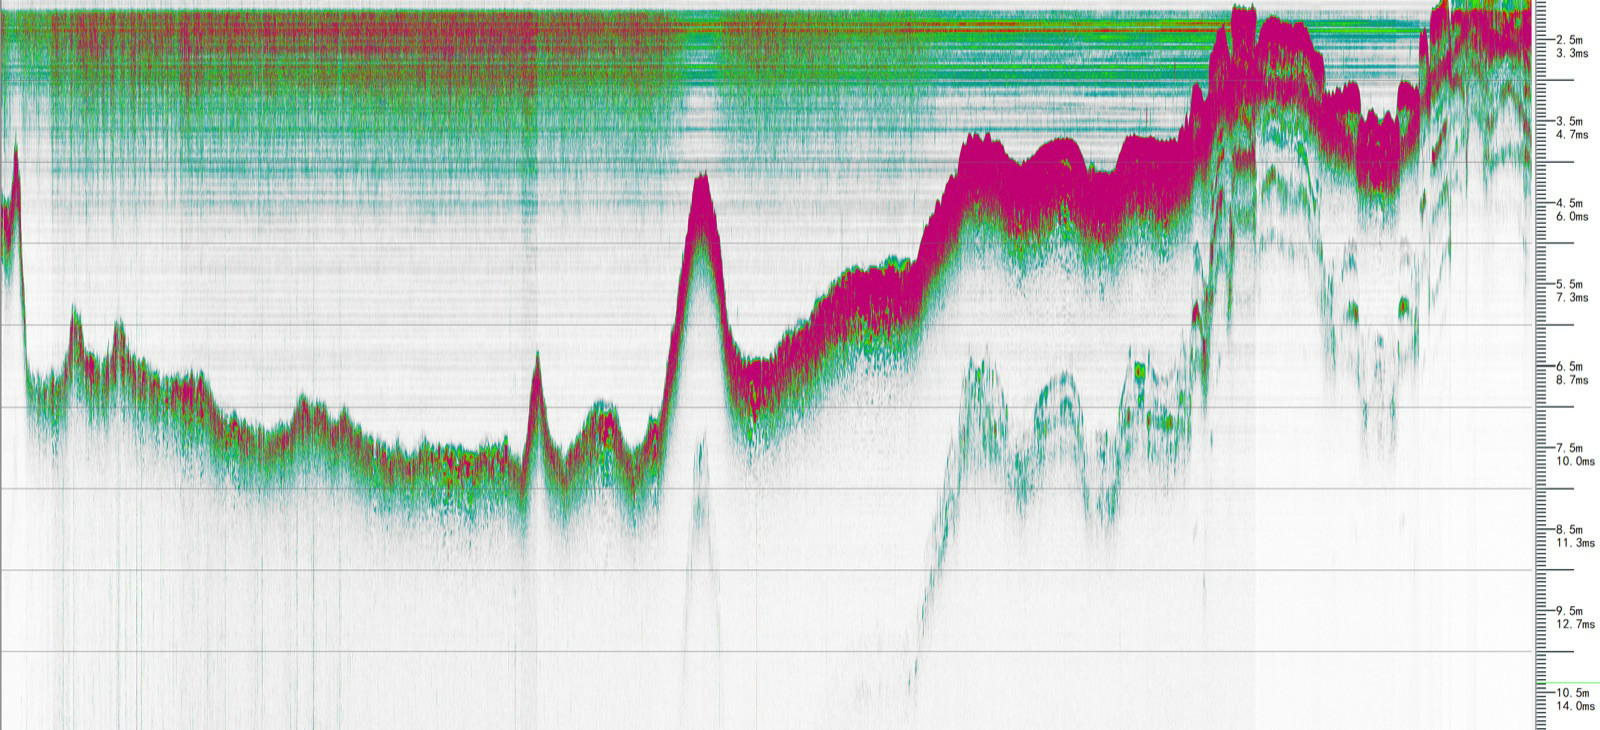
[Fig. 14 — Cross-section at SSC 150 kg/m³]
Verification dataset — 16:31, SSC 60 kg/m³, current 2 m/s. A comparison run showed instrument depths in close agreement with sounding-weight values:
| No. | Time | Chainage (m) | Instrument (m) | Weight/Pole (m) | Diff. (m) |
| 1 | 16:53 | 85 | 4.20 | 4.20 | 0.00 |
| 2 | 17:01 | 110 | 6.50 | 6.50 | 0.00 |
| 3 | 17:06 | 130 | 7.10 | 7.00 | +0.10 |
| 4 | 17:21 | 150 | 7.46 | 7.30 | +0.16 |
| 5 | 17:26 | 170 | 7.10 | 6.70 | +0.40 |
| 6 | 17:31 | 190 | 5.20 | 5.14 | +0.06 |
| 7 | 17:33 | 210 | 4.10 | 4.00 | +0.10 |
| 8 | 17:36 | 200 | 5.07 | 4.88 | +0.19 |
| 9 | 17:41 | 180 | 6.20 | 6.10 | +0.10 |
| 10 | 17:45 | 170 | 7.40 | 7.00 | +0.40 |
| 11 | 17:49 | 160 | 7.69 | 7.60 | +0.09 |
| 12 | 17:52 | 140 | 7.28 | 7.20 | +0.08 |
| 13 | 17:56 | 120 | 6.86 | 6.83 | +0.03 |
| 14 | 17:59 | 100 | 4.60 | 4.50 | +0.10 |
Note: the sounding weight was positioned ~5 m upstream of the instrument; this spatial separation accounts for part of the observed differences. Instrument readings agreed more closely with co-located sounding-pole measurements.
Station B: USV Deployment, Joint Operation with ADCP
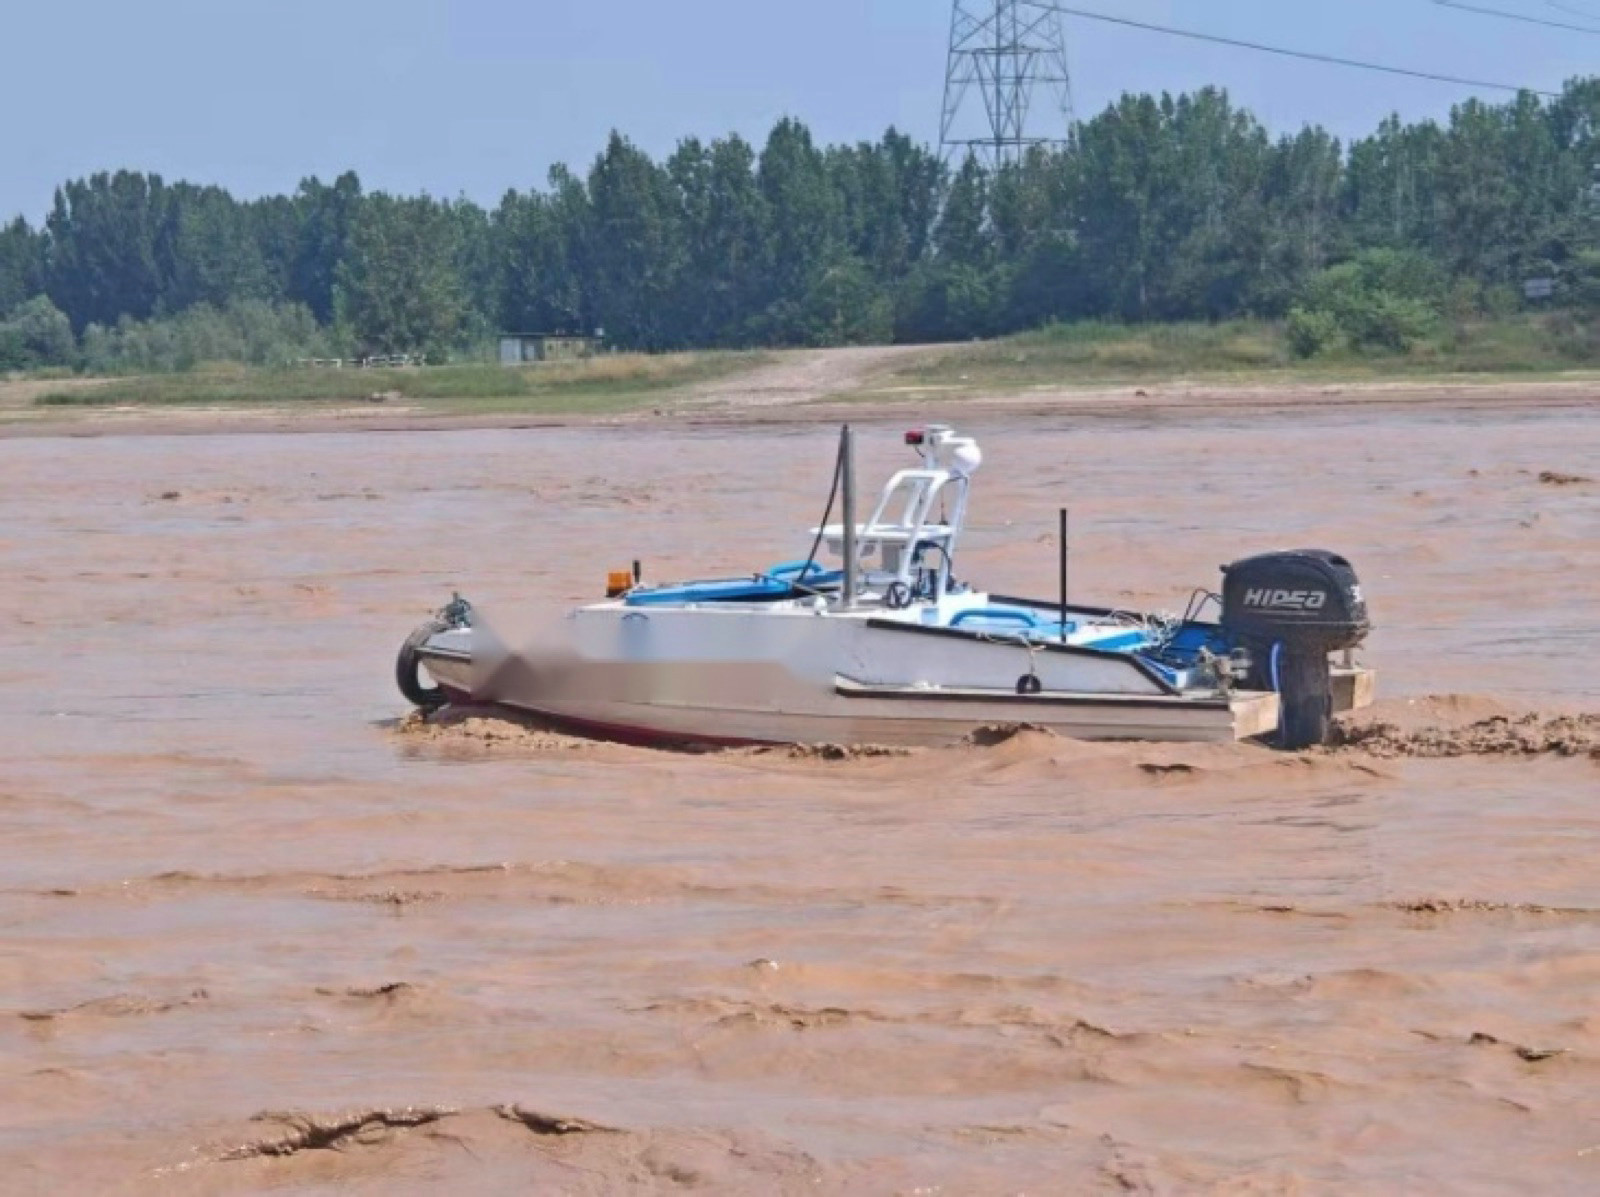
July 9, 09:16, SSC 60 kg/m³, current 2.9 m/s, discharge 1,500 m³/s. Mounted on a USV at only 13 cm draft, the instrument completed outbound and return cross-section lines.
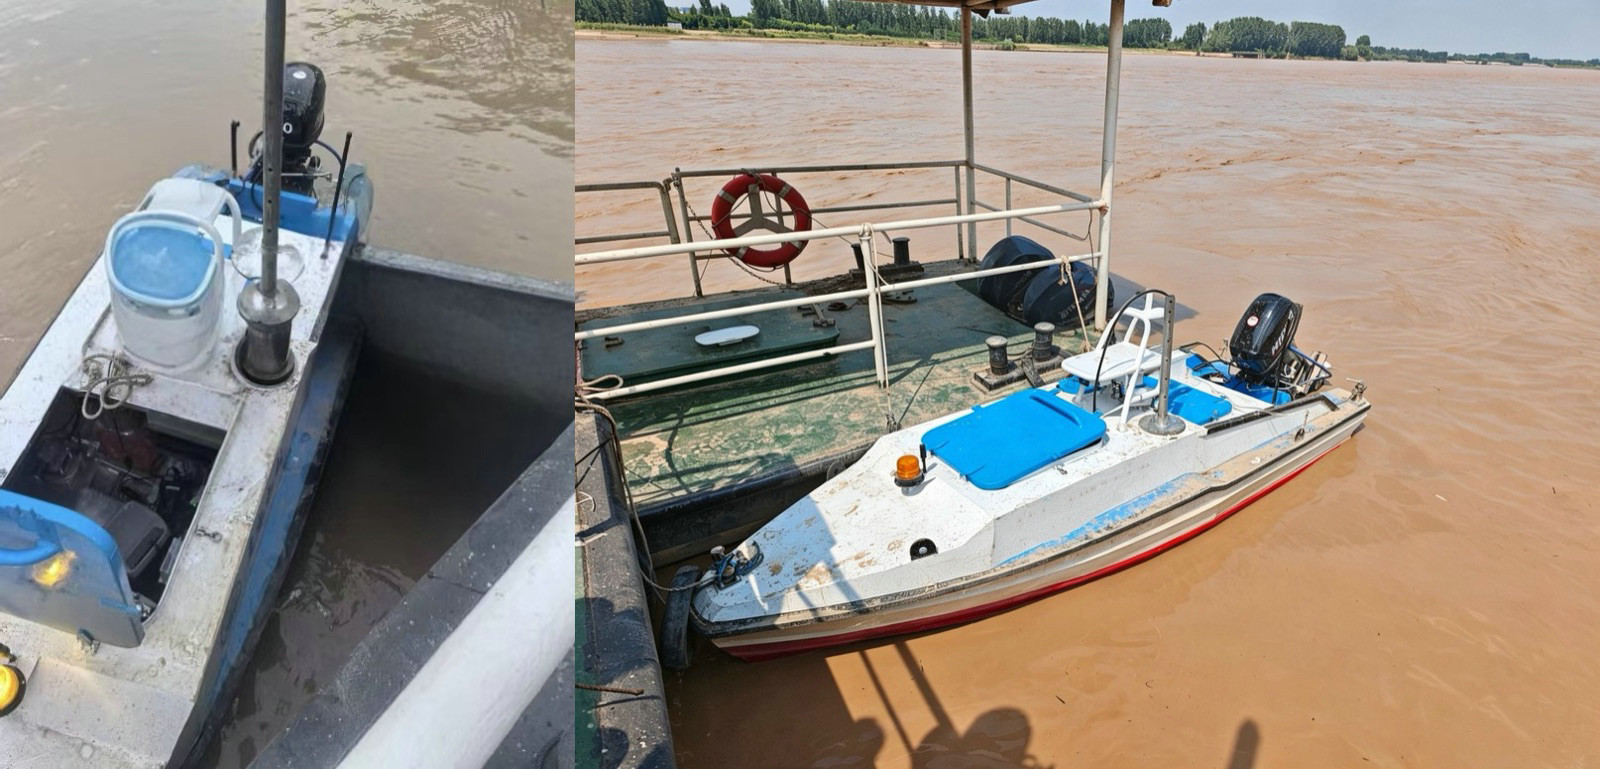
[Fig. 3 — USV integration and transducer mounting]
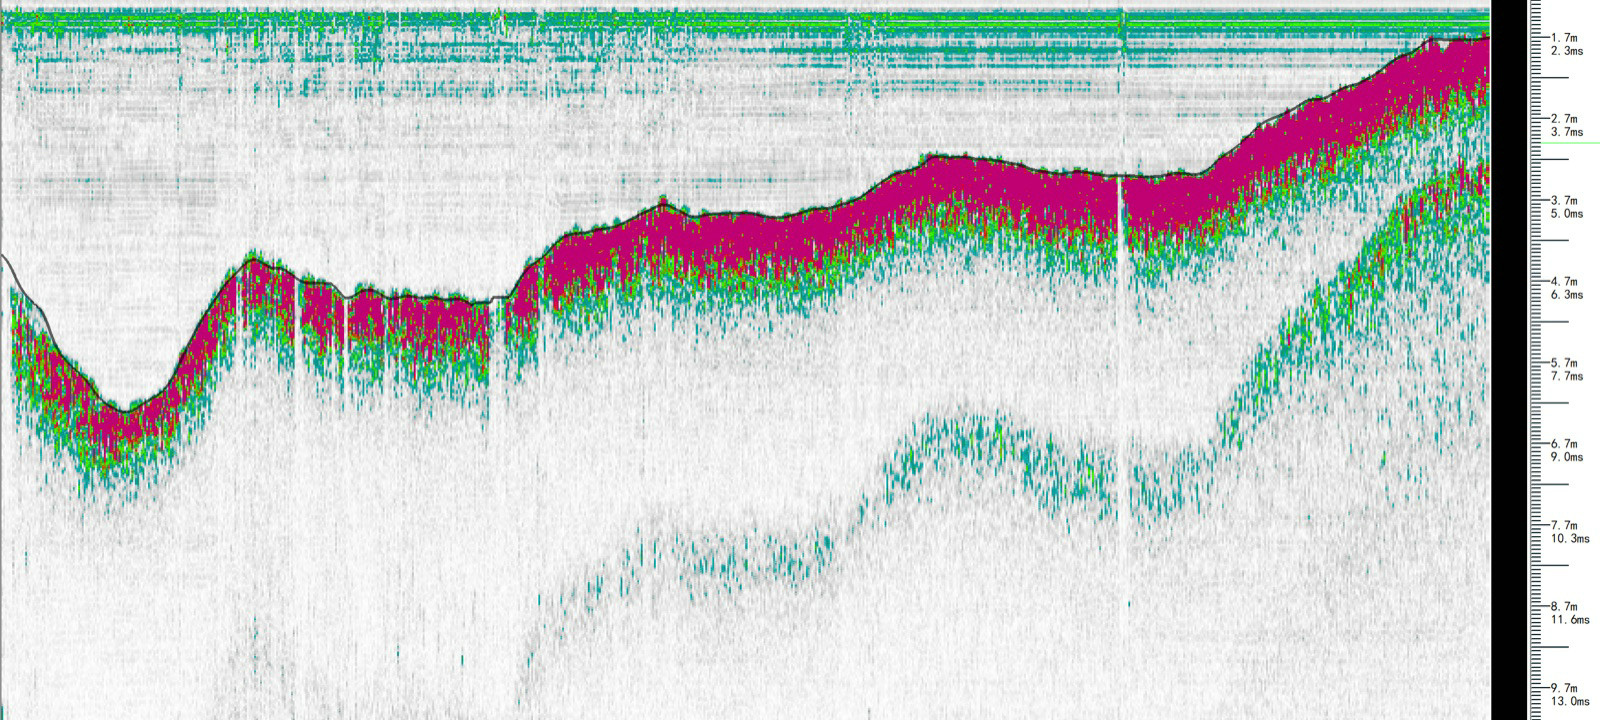
[Fig. 18 — Outbound cross-section]
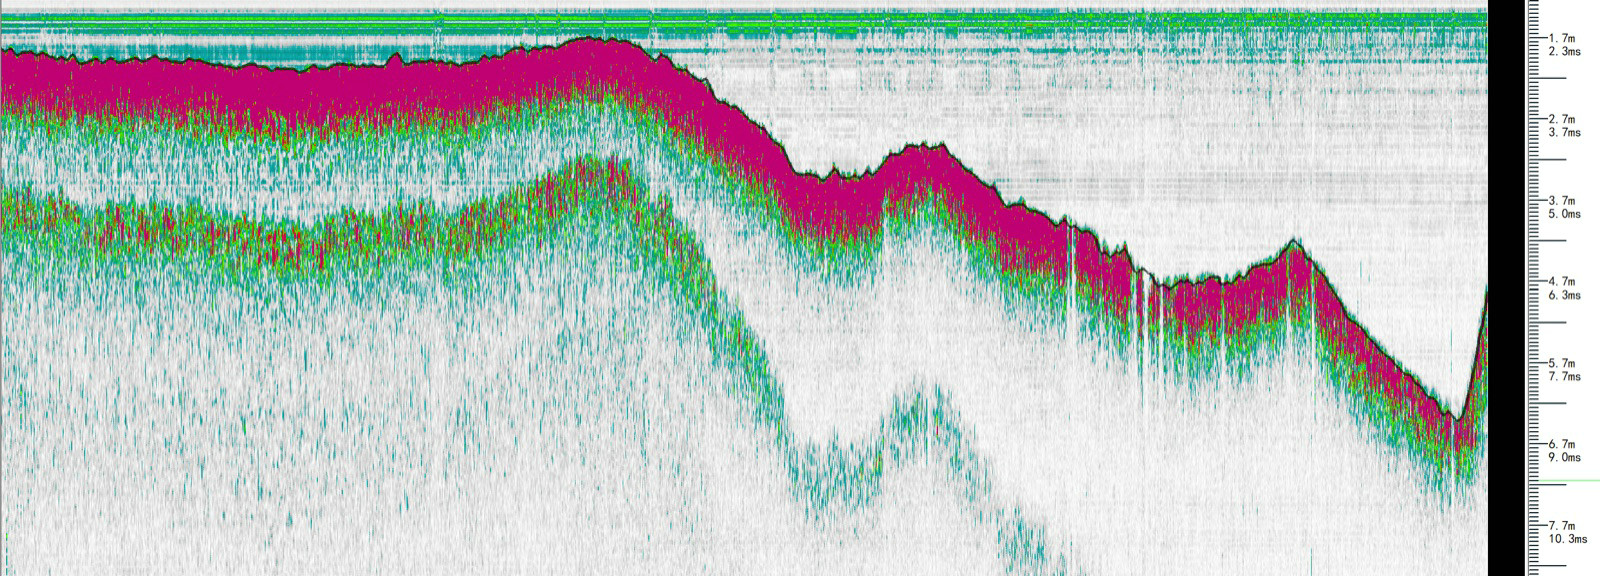
[Fig. 19 — Return cross-section]
Joint deployment — On the afternoon of July 9, the partner's technicians resolved a cable issue with the ADCP's GNSS unit; dockside testing confirmed normal joint operation of the sub-bottom profiler and ADCP. With SSC at 60–70 kg/m³ and section-average currents of 3.05 m/s (peaking at 4 m/s), the instrument showed intermittent loss of echo energy once the survey proper began.
Diagnosis — Hover tests in the main current and dockside comparison tests (including manually rocking the USV to exaggerate roll and pitch, even lifting the bow more than ten degrees) produced no comparable loss of echo energy. The analysis attributed the instability to violent USV attitude changes in the fast current: with only 13 cm draft, the transducer sits extremely shallow, and at >3 m/s the vessel's pitch and roll could intermittently bring it near or above the surface, degrading transmission and reception. The finding sets a clear attitude-stability requirement for transducer installation on USV platforms operating in high-current conditions.
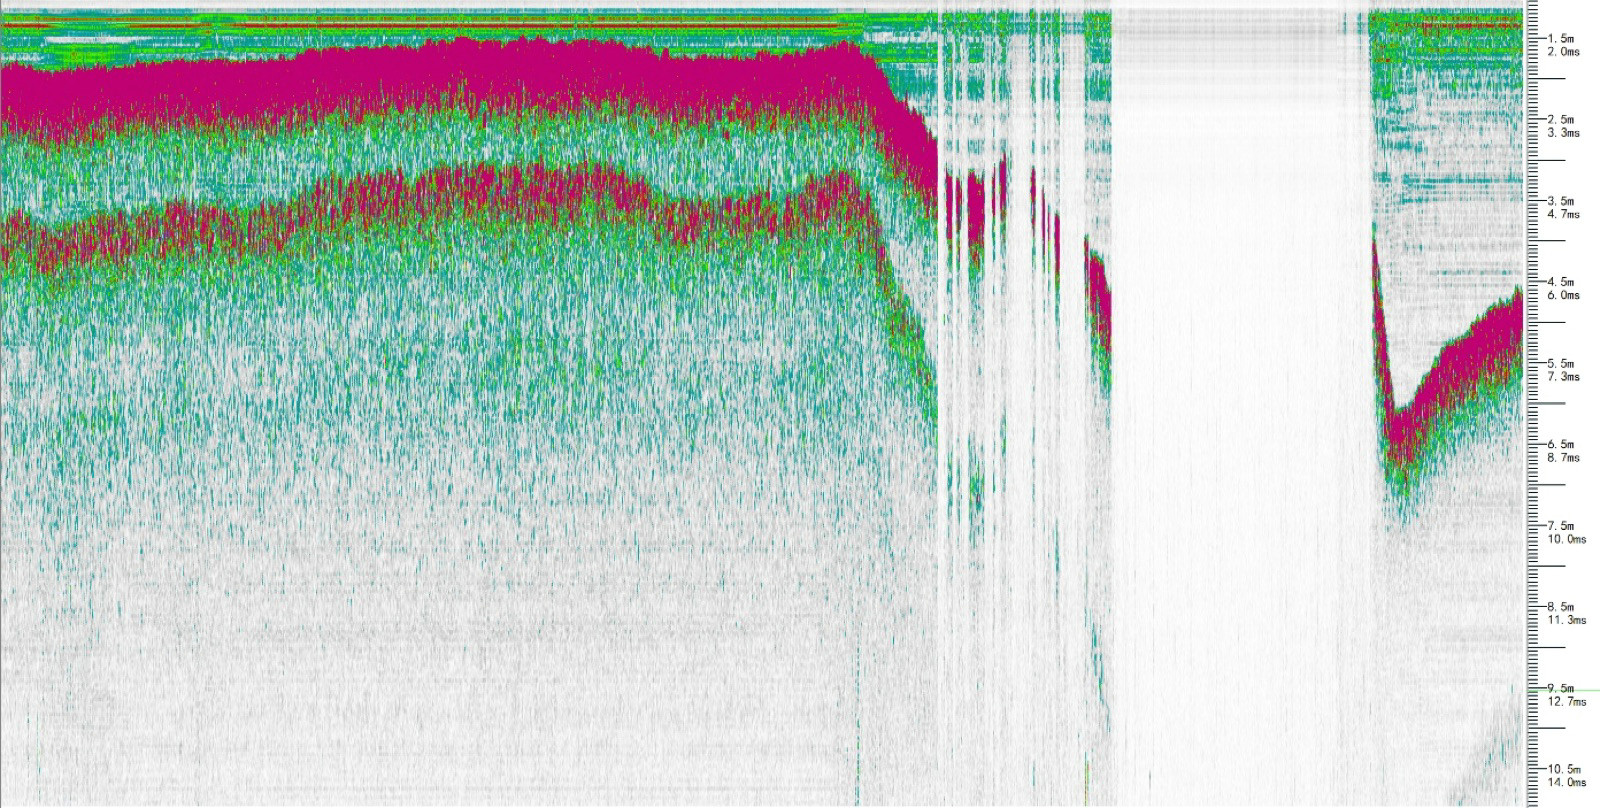
[Fig. 20 — Intermittent echo loss in fast current]
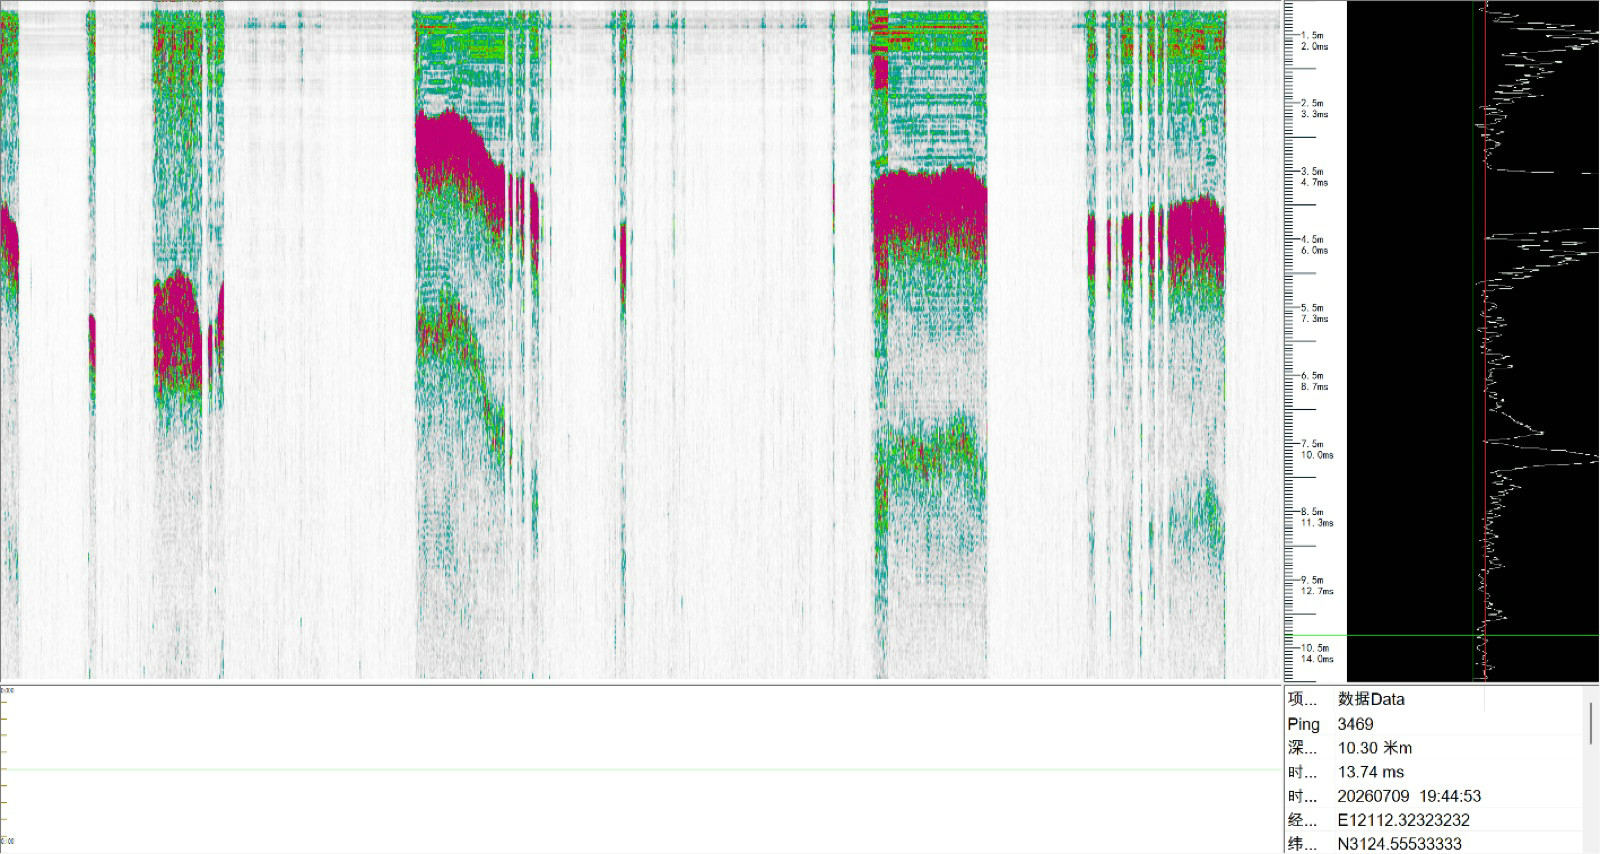
[Fig. 21 — Hover test in the main current]
Conclusions
Over three days of trials under the extreme conditions of the Yellow River's water-sediment regulation period, the parametric sub-bottom profiler was comprehensively verified:
1. Strong tolerance of high sediment loads — Valid returns were acquired across SSC of 60–204 kg/m³; at 165–170 kg/m³ the signal remained clear with headroom to spare, demonstrating the penetration capability of parametric technology in turbid waters.
2. Reliable sounding accuracy — Fourteen verification points showed overall agreement with sounding-weight/pole references, with mean deviations on the order of 10–20 cm, meeting hydrographic cross-section survey requirements.
3. Well-characterized frequency response — The 10 kHz band performed best, with Chirp optimal at 8–12 kHz, providing practical parameter guidance for comparable environments.
4. Platform integration insight — Side-mount deployment was stable across all conditions; USV deployment in fast currents (>3 m/s) at very shallow draft requires an optimized transducer installation to keep the transducer reliably submerged.
The trial demonstrates the instrument's performance in high-sediment channel surveying and adds valuable field experience for the application of parametric technology in hydrology and water resources engineering.