EML-3X Route Survey of a 38 mm Subsea Fibre-Optic Cable
2026-11-13
Project at a glance
Products:EML-3X Subsea EM Locator System
Location:Nearshore waters
Vessel speed:Approximately 4 knots
Installation:EML-3X sensor carried on a USV towed by the survey vessel
Water depth:Approximately 10 m
Cable diameter:38 mm
Survey length: approximately 3.4 km
Applied tracing signal: 33 Hz, 150 mA
The project team used EML-3X to survey approximately 3.4 km of a normally unpowered, 38 mm-diameter subsea fibre-optic cable in nearshore sandy conditions, at a water depth of approximately 10 m. A survey vessel towed a small USV carrying the probe, while the cable operator applied a 33 Hz, 150 mA tracing signal.
Survey area and objective
The task was to compile a plan-view cable route and position records for comparison with existing route information and maintenance planning.
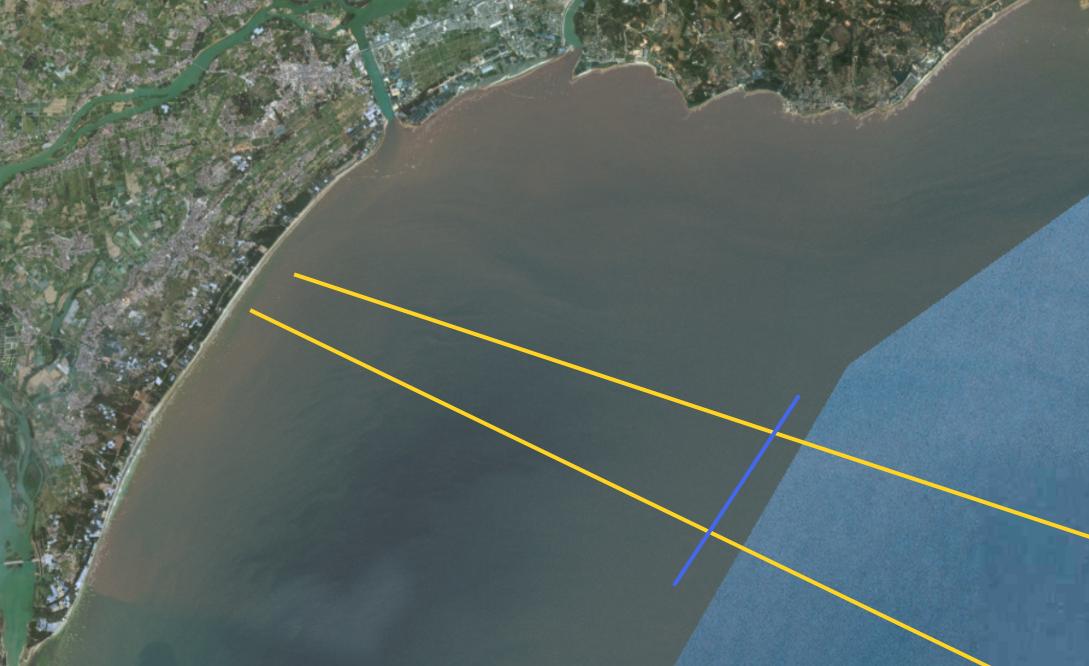
Survey-area overview from the project report.
Active tracing and three-axis measurements
The cable operator applied a 33 Hz sinusoidal signal at 150 mA. EML-3X recorded the X, Y and Z magnetic-field components during each crossing, with waveform review, tracks and markers brought together in CableDetect.
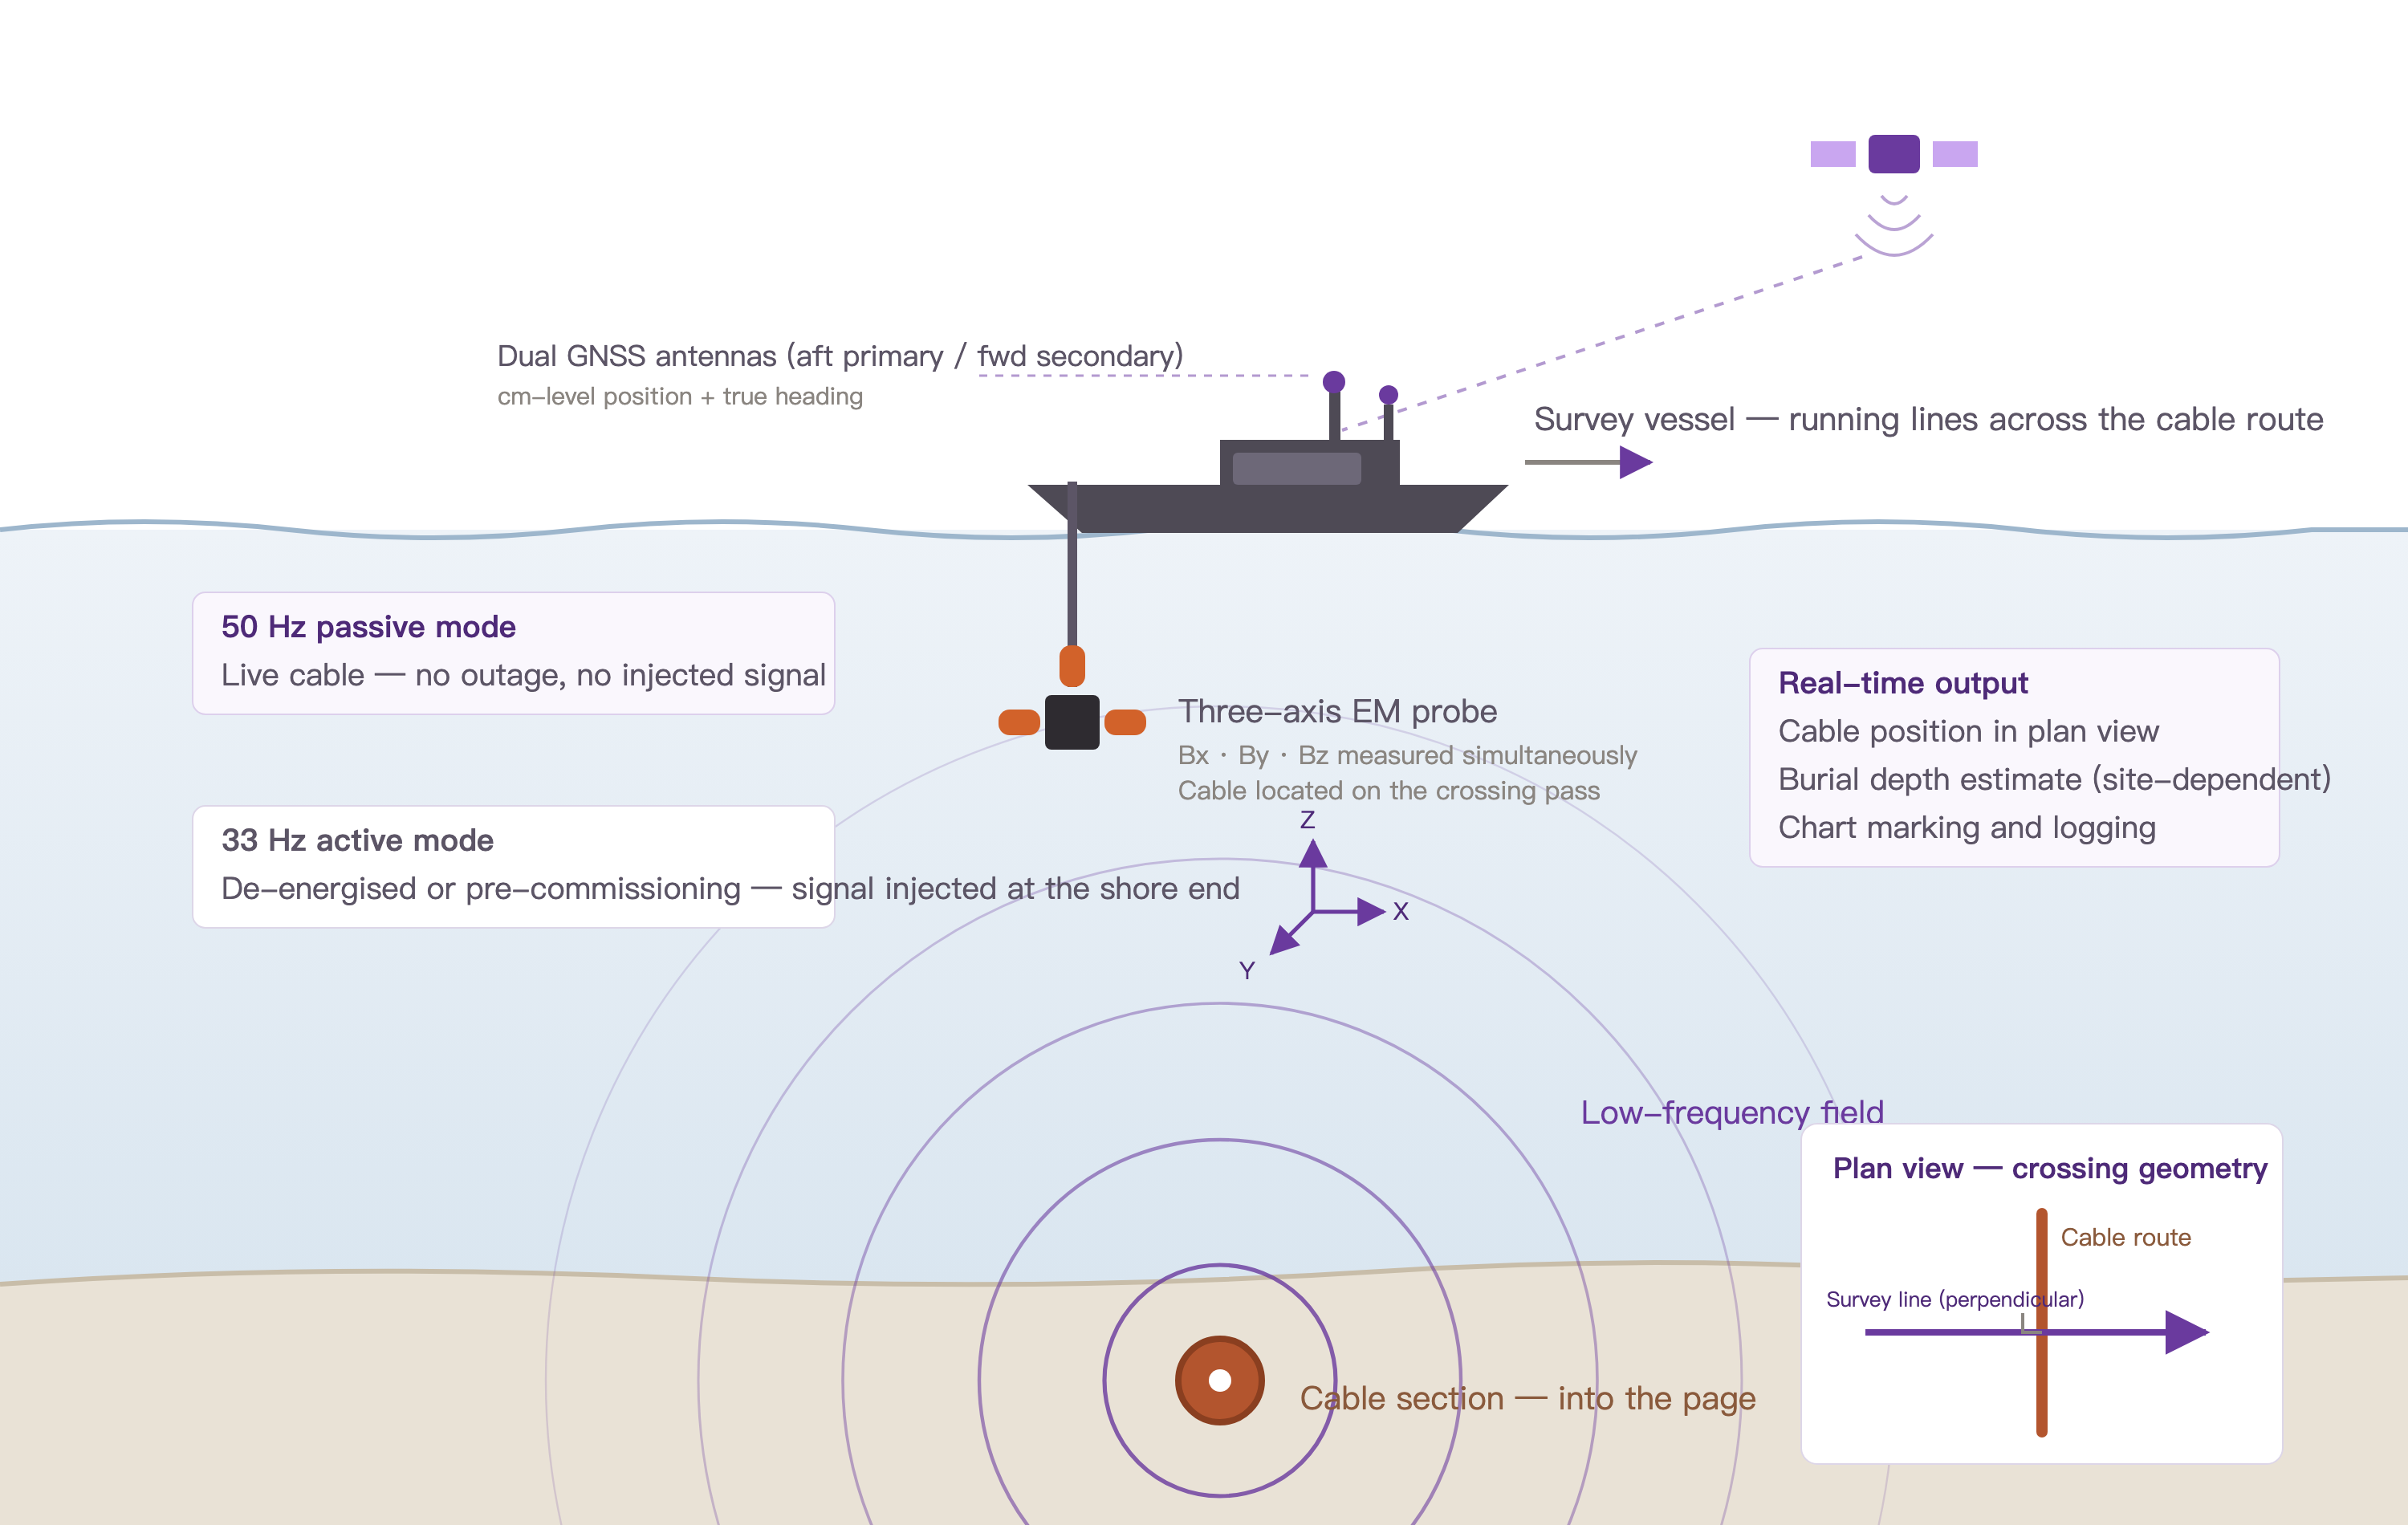
General EML-3X operating principle, illustrated with a vessel-side mount. The field photographs below show the towed-USV arrangement used in this project.
From vessel-side mounting to a towed USV
The first vessel-side installation was affected by onboard electrical interference. The team moved the probe onto a small USV towed behind the survey vessel. With the USV propulsion switched off, it served as a sensor carrier while the survey vessel provided the tow. The field team reported clearer crossing features after increasing the separation from vessel equipment.
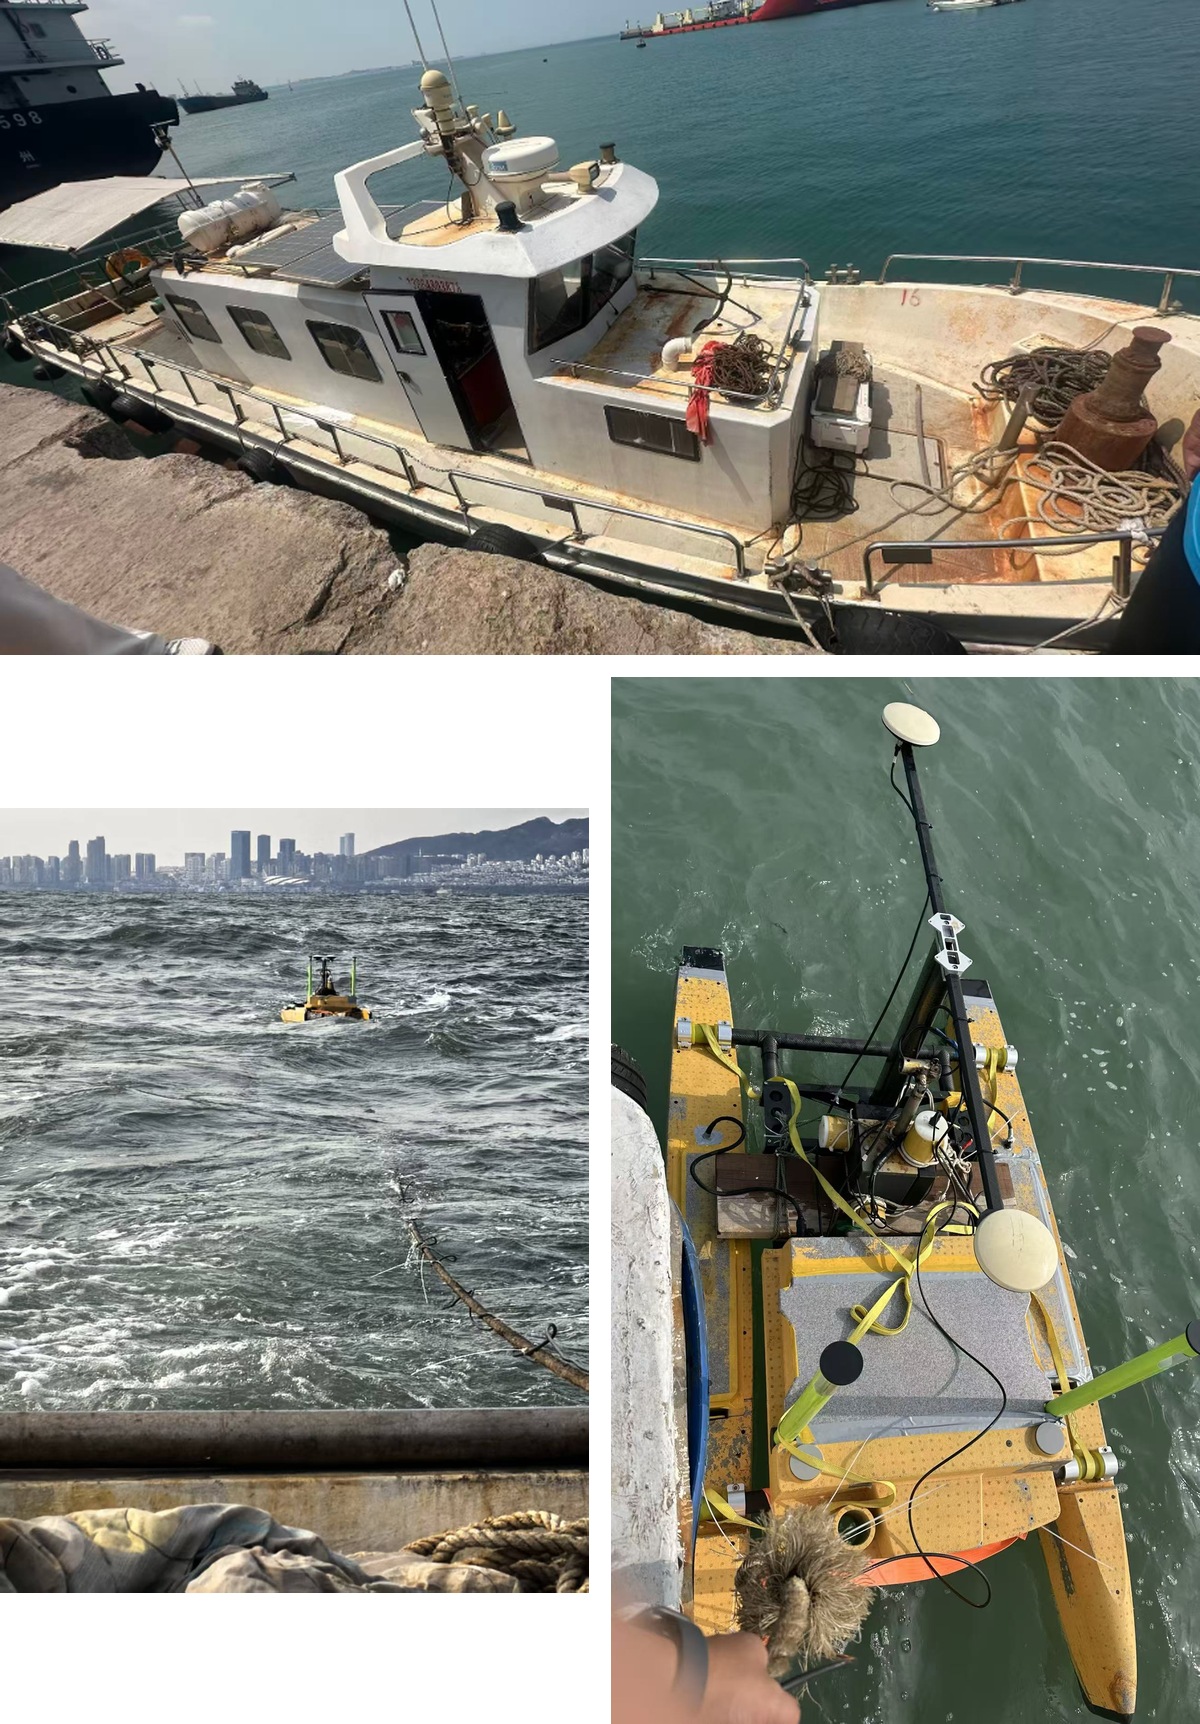
Field deployment. Top: survey vessel. Lower left: towed USV and tow connection. Lower right: USV deck and GNSS antennas.
Cross-route lines and crossing markers
Survey lines crossed the cable route at 50 m intervals, at approximately four knots. Operators reviewed waveforms with the track and compared neighbouring crossings, including weaker-signal sections.
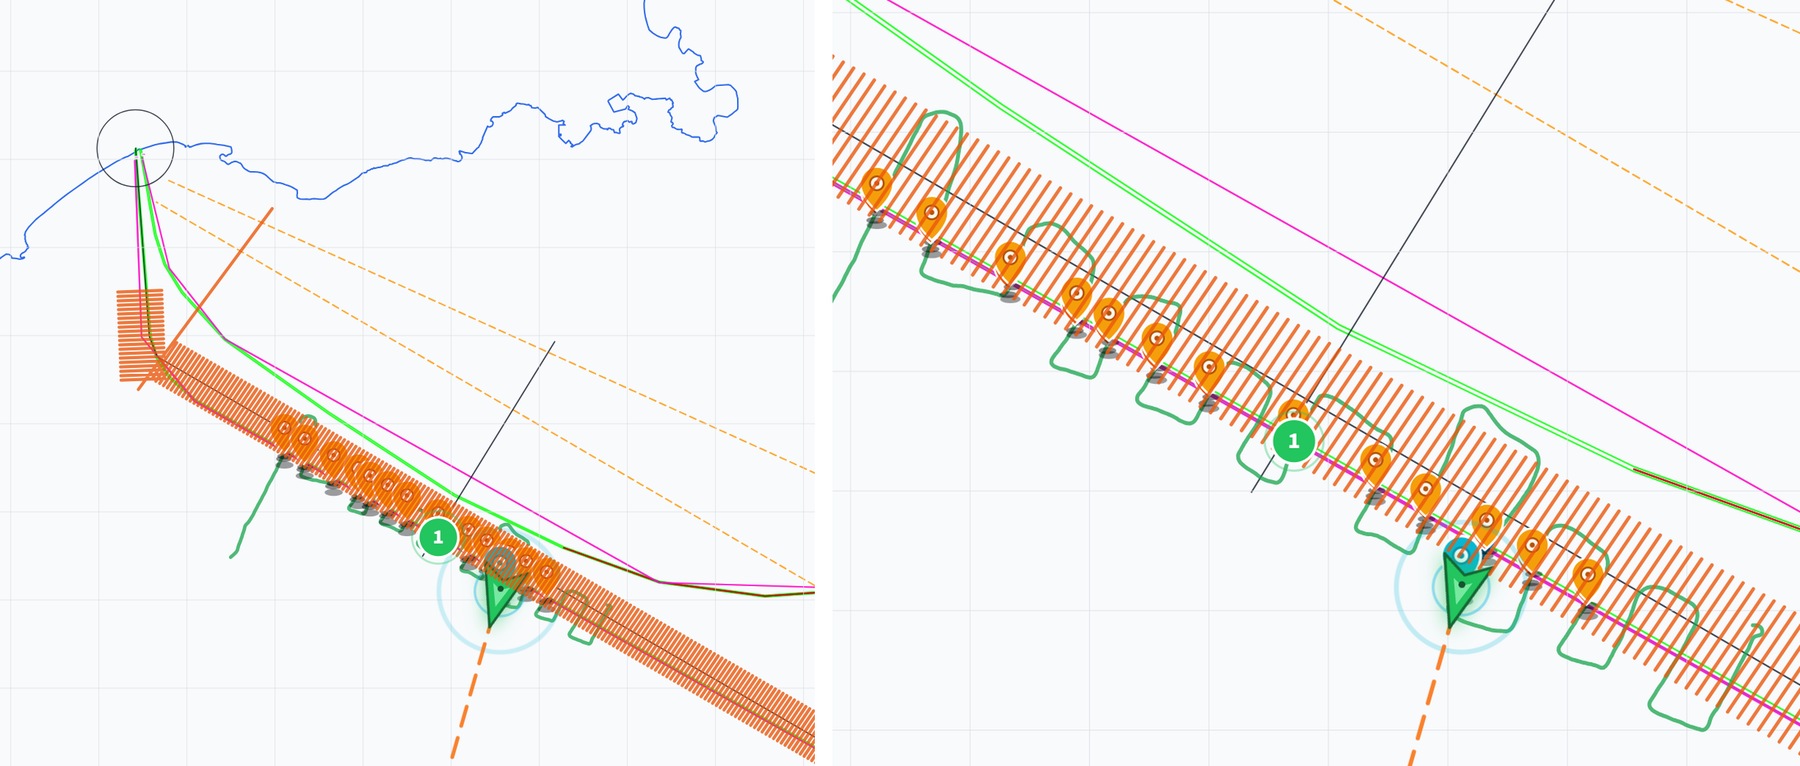
Left: survey-line layout and crossing tracks. Right: candidate crossings and markers.
Twelve recorded crossings
All twelve waveform excerpts supplied in the project report are shown below. Blue: X; green: Y; orange: Z. Purple lines mark the selected interval; the green dashed line marks the interpreted crossing. Display scales are retained from the originals. Select an image to view it at full size.
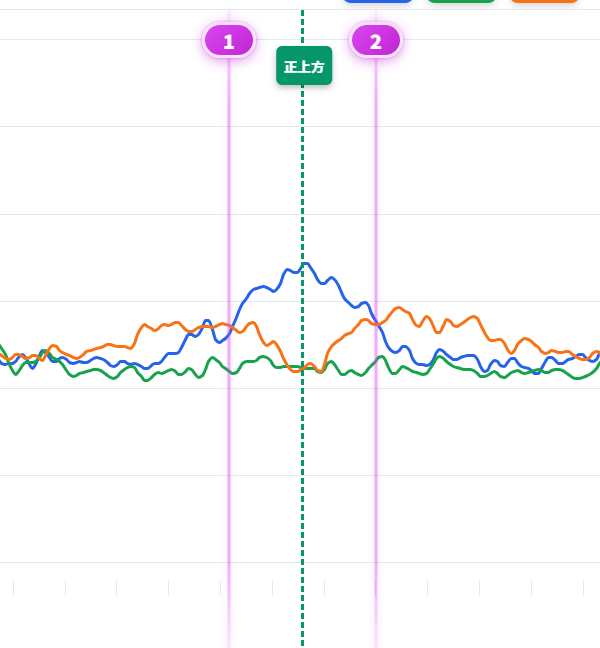
Crossing markers 1 / 2
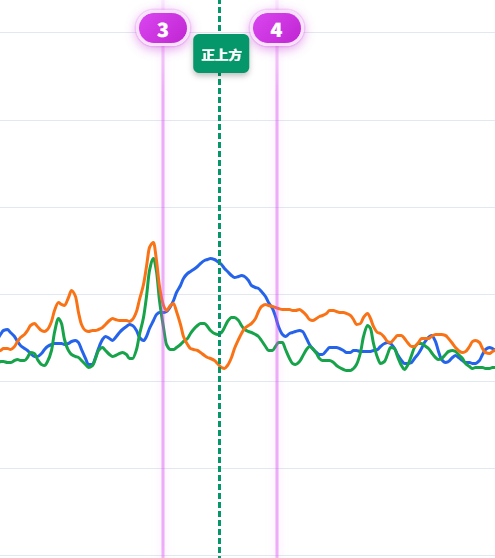
Crossing markers 3 / 4
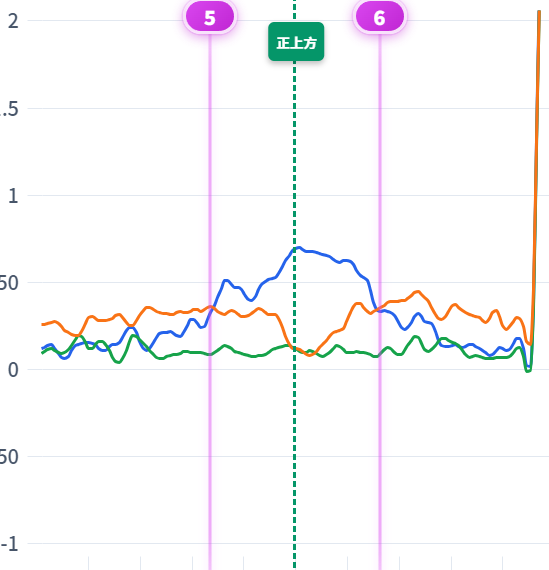
Crossing markers 5 / 6
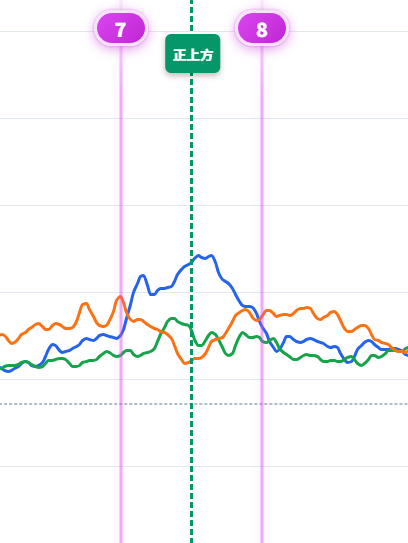
Crossing markers 7 / 8
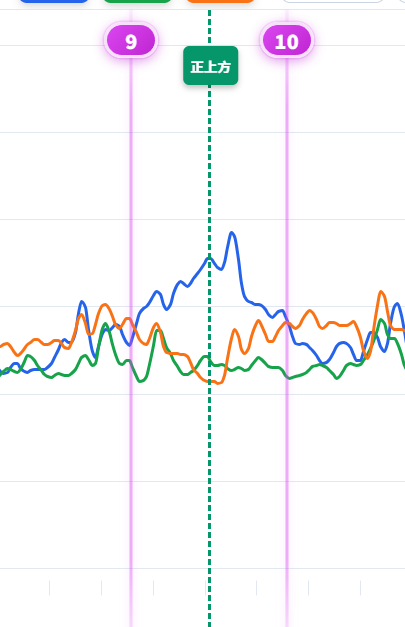
Crossing markers 9 / 10
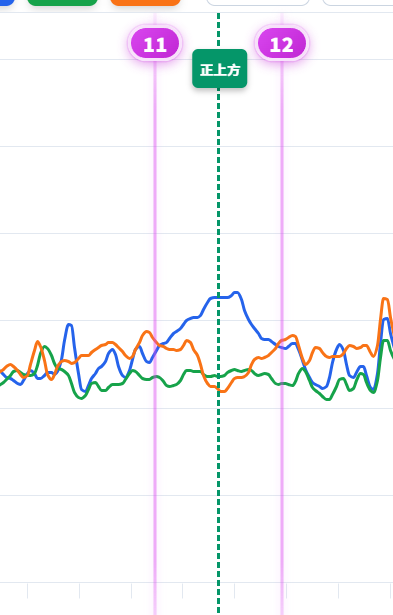
Crossing markers 11 / 12
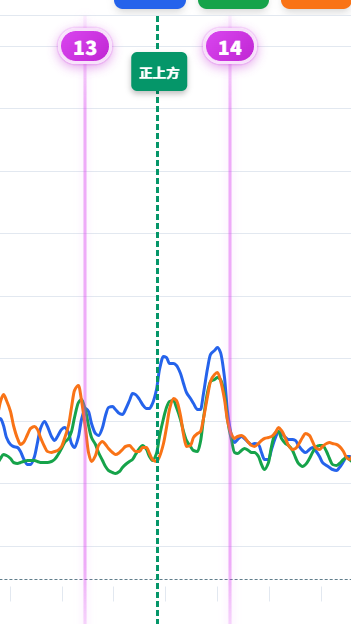
Crossing markers 13 / 14
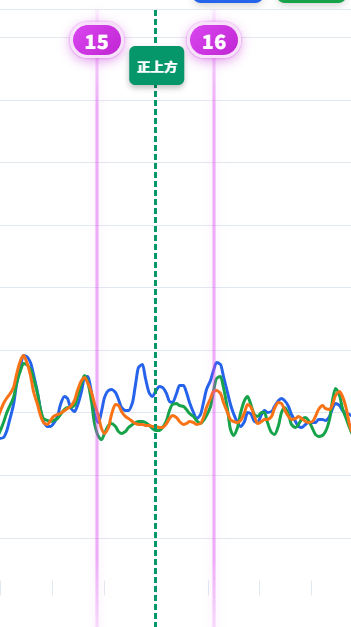
Crossing markers 15 / 16
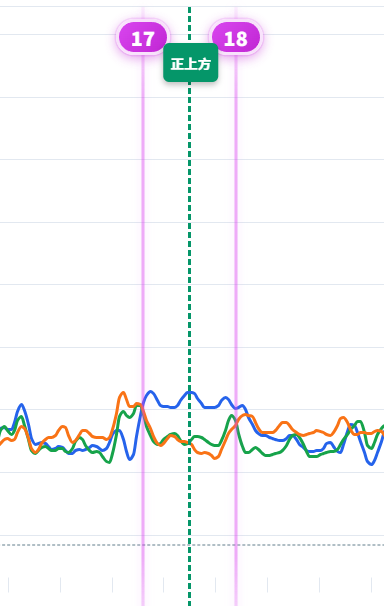
Crossing markers 17 / 18
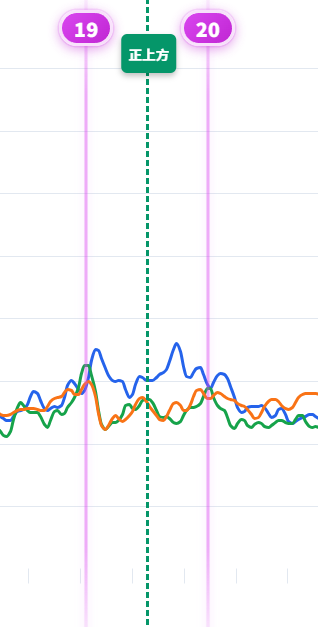
Crossing markers 19 / 20
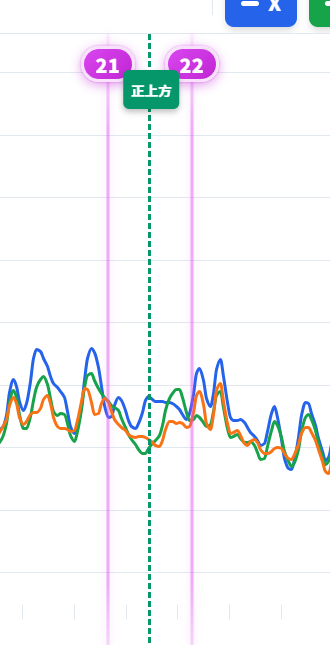
Crossing markers 21 / 22
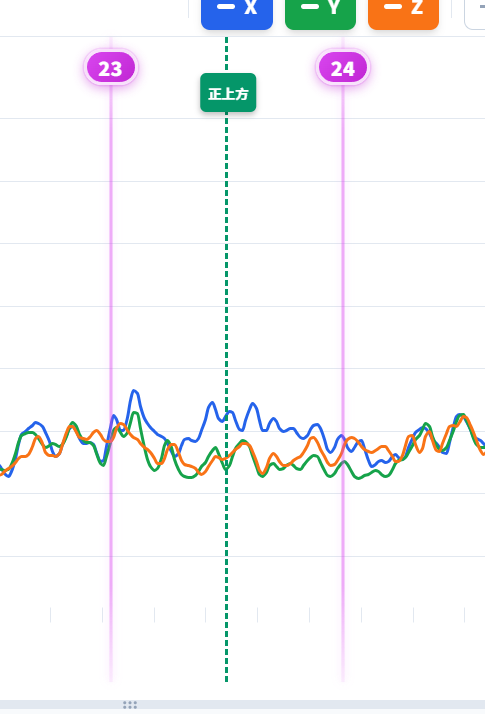
Crossing markers 23 / 24
Compiling the plan-view route
Waveform playback, tracks and neighbouring crossings were used together to extract positions and compile the approximately 3.4 km route. The diagram compares measured positions with the supplied route information.
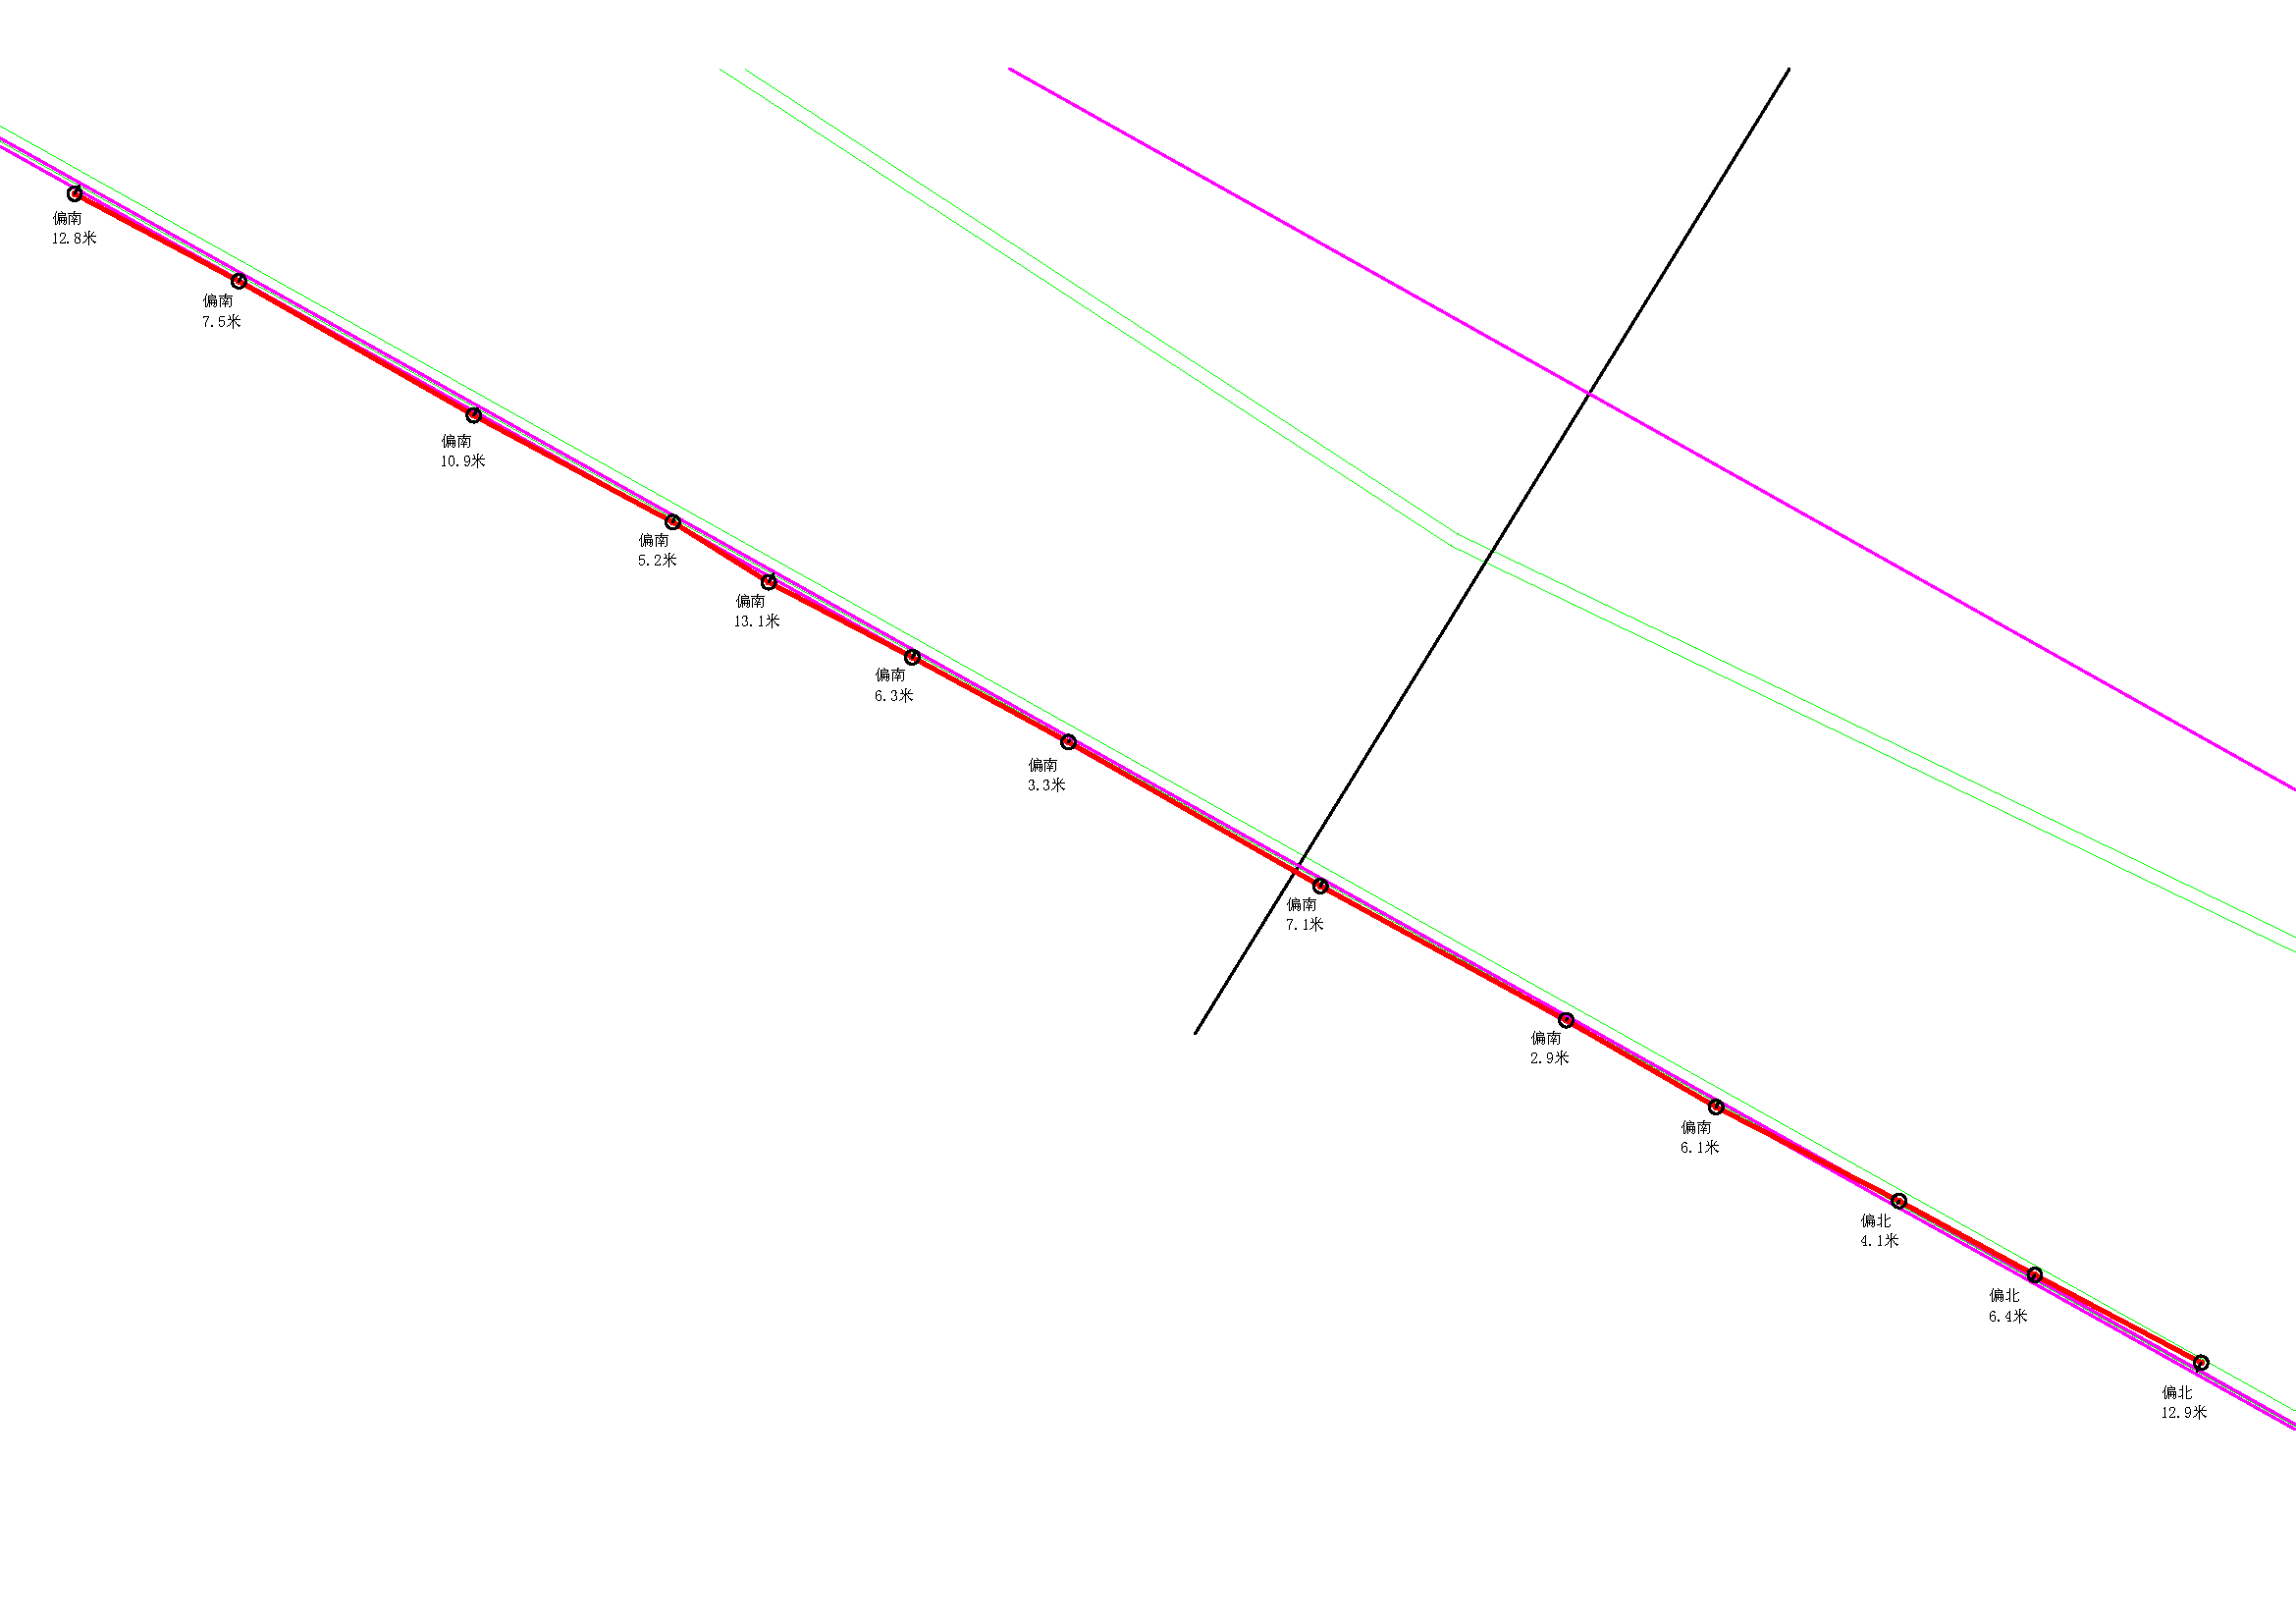
Route comparison from the report. The south/north offsets describe differences from the supplied route, rather than instrument positioning error.
People behind the survey
Swell and cross-currents made line keeping, looking after the towed platform and reviewing records part of the daily field work.
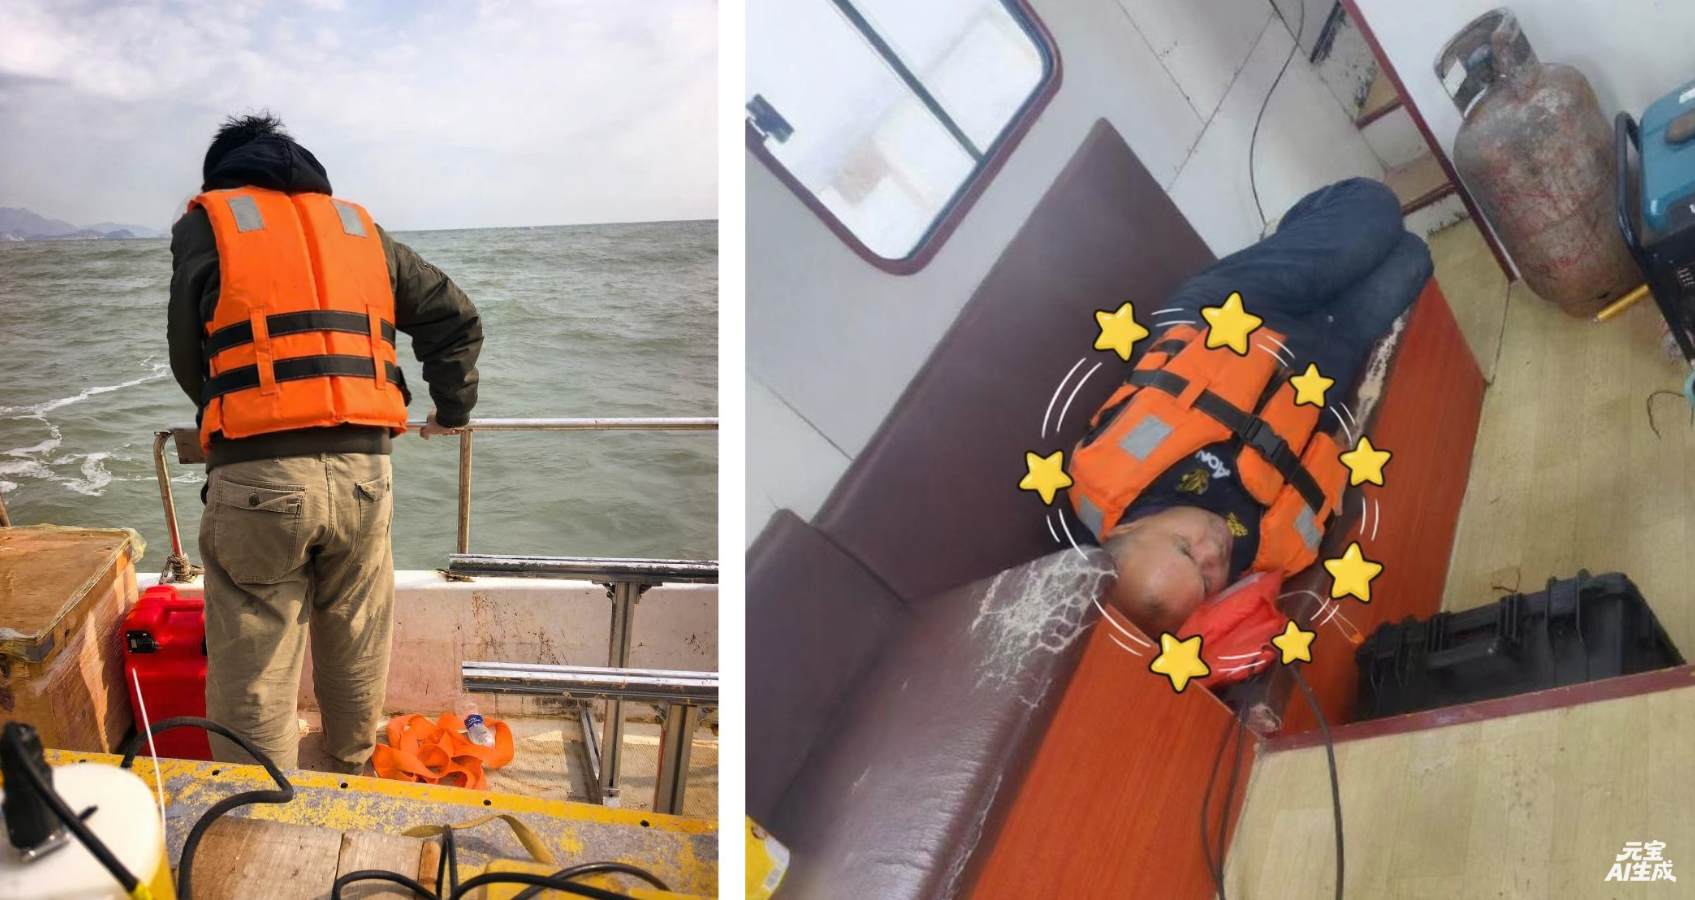
Field moments: the survey team on deck and resting between tasks.
The delivered results focused on the plan-view route and position records. The applied tracing signal, towed-USV installation and review of multiple crossings formed the practical survey method.
Discuss a similar project
Tell us about your platform, operating conditions and the results you need. We will help identify a suitable configuration.